As we have seen, electric charges create an electric field in the space surrounding them. It is useful to have a kind of “map” that gives the direction and indicates the strength of the field at various places. The great English physicist Michael Faraday (1791–1867) proposed an idea that provides such a “map,” the idea of electric field lines. Since the electric field is the electric force per unit charge, the electric field lines are sometimes called lines of force.
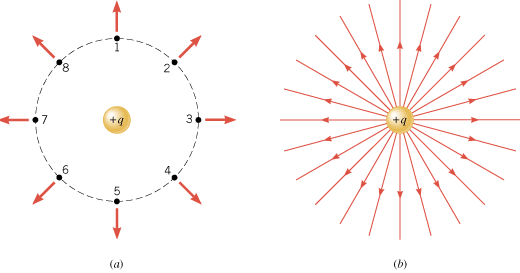
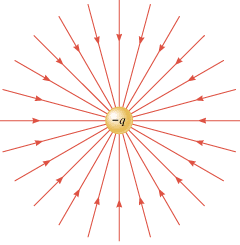
To introduce the electric field line concept, Figure 18.23a shows a positive point charge +q. At the locations numbered 1–8, a positive test charge would experience a repulsive force, as the arrows in the drawing indicate. Therefore, the electric field created by the charge +q is directed radially outward. The electric field lines are lines drawn to show this direction, as part b of the drawing illustrates. They begin on the charge +q and point radially outward. Figure 18.24 shows the field lines in the vicinity of a negative charge –q. In this case they are directed radially inward because the force on a positive test charge is one of attraction, indicating that the electric field points inward. In general, electric field lines are always directed away from positive charges and toward negative charges.
 | | Figure 18.23
(a) At any of the eight marked spots around a positive point charge +
q, a positive test charge would experience a repulsive force directed radially outward. (b) The electric field lines are directed radially outward from a positive point charge +
q. |
|
 | | Figure 18.24
The electric field lines are directed radially inward toward a negative point charge –
q. |
|
The electric field lines in Figures 18.23 and 18.24 are drawn in only two dimensions, as a matter of convenience. Field lines radiate from the charges in three dimensions, and an infinite number of lines could be drawn. However, for clarity only a small number is ever included in pictures. The number is chosen to be proportional to the magnitude of the charge; thus, five times as many lines would emerge from a +5q charge as from a +q charge.
The pattern of electric field lines also provides information about the magnitude or strength of the field. Notice in Figures 18.23 and 18.24 that near the charges, where the electric field is stronger, the lines are closer together. At distances far from the charges, where the electric field is weaker, the lines are more spread out. It is true in general that the electric field is stronger in regions where the field lines are closer together. In fact, no matter how many charges are present, the number of lines per unit area passing perpendicularly through a surface is proportional to the magnitude of the electric field.
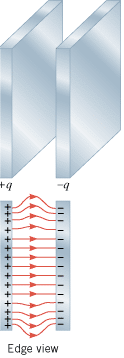
In regions where the electric field lines are equally spaced, there is the same number of lines per unit area everywhere, and the electric field has the same strength at all points. For example, Figure 18.25 shows that the field lines between the plates of a parallel plate capacitor are parallel and equally spaced, except near the edges where they bulge outward. The equally spaced, parallel lines indicate that the electric field has the same magnitude and direction at all points in the central region of the capacitor.
 | | Figure 18.25
In the central region of a parallel plate capacitor, the electric field lines are parallel and evenly spaced, indicating that the electric field there has the same magnitude and direction at all points. |
|
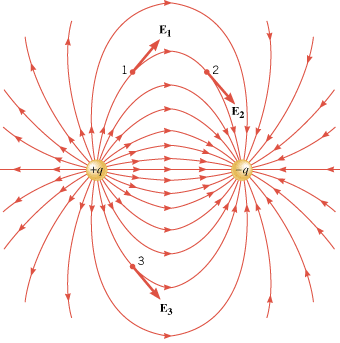
Often, electric field lines are curved, as in the case of an electric dipole. An electric dipole consists of two separated point charges that have the same magnitude but opposite signs. The electric field of a dipole is proportional to the product of the magnitude of one of the charges and the distance between the charges. This product is called the dipole moment. Many molecules, such as H2O and HCl, have dipole moments. Figure 18.26 depicts the field lines in the vicinity of a dipole. For a curved field line, the electric field vector at a point is tangent to the line at that point (see points 1, 2, and 3 in the drawing). The pattern of the lines for the dipole indicates that the electric field is greatest in the region between and immediately surrounding the two charges, since the lines are closest together there.
 | | Figure 18.26
The electric field lines of an electric dipole are curved and extend from the positive to the negative charge. At any point, such as 1, 2, or 3, the field created by the dipole is tangent to the line through the point. |
|
Notice in Figure 18.26 that any given field line starts on the positive charge and ends on the negative charge. In general, electric field lines always begin on a positive charge and end on a negative charge and do not start or stop in midspace. Furthermore, the number of lines leaving a positive charge or entering a negative charge is proportional to the magnitude of the charge. This means, for example, that if 100 lines are drawn leaving a +4 mC charge, then 75 lines would have to end on a –3 mC charge and 25 lines on a –1 mC charge. Thus, 100 lines leave the charge of +4 mC and end on a total charge of –4 mC, so the lines begin and end on equal amounts of total charge.
The electric field lines are also curved in the vicinity of two identical charges. Figure 18.27 shows the pattern associated with two positive point charges and reveals that there is an absence of lines in the region between the charges. The absence of lines indicates that the electric field is relatively weak between the charges.
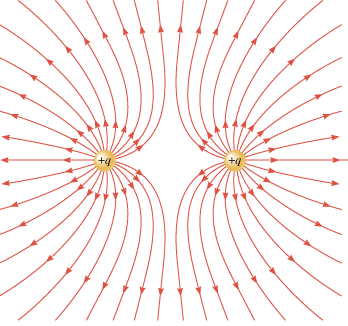 | | Figure 18.27
The electric field lines for two identical positive point charges. If the charges were both negative, the directions of the lines would be reversed. |
|
Some of the important properties of electric field lines are reexamined in Conceptual Example 12.
| Conceptual Example 12 Drawing Electric Field Lines |
 |
|
Figure 18.28a shows three negative point charges (–q, –q, and –2q) and one positive point charge (+4q), along with some electric field lines drawn between the charges. There are three things wrong with this drawing. What are they?
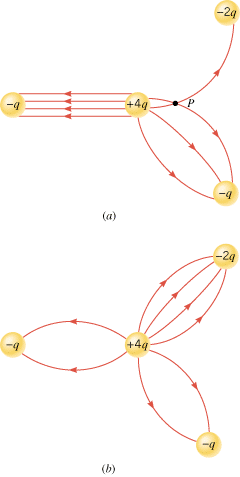 | | Figure 18.28
(a) Incorrectly and (b) correctly drawn electric field lines. |
|
Reasoning and Solution One aspect of Figure 18.28a that is incorrect is that electric field lines cross at point P. Field lines can never cross, and here’s why. An electric charge placed at P experiences a single net force due to the presence of the other charges in its environment. Therefore, there is only one value for the electric field (which is the force per unit charge) at that point. If two field lines intersected, there would be two electric fields at the point of intersection, one associated with each line. Since there can be only one value of the electric field at any point, there can be only one electric field line passing through that point.
Another mistake in Figure 18.28a is the number of electric field lines that end on the negative charges. Remember that the number of field lines leaving a positive charge or entering a negative charge is proportional to the magnitude of the charge. The –2q charge has half the magnitude of the +4q charge. Therefore, since 8 lines leave the +4q charge, 4 of them (one-half of them) must enter the –2q charge. Of the remaining 4 lines that leave the positive charge, 2 enter each of the –q charges, according to a similar line of reasoning.
The third error in Figure 18.28a is the way in which the electric field lines are drawn between the +4q charge and the –q charge at the left of the drawing. As drawn, the lines are parallel and evenly spaced. This would indicate that the electric field everywhere in this region has a constant magnitude and direction, as is the case in the central region of a parallel plate capacitor. But the electric field between the +4q and –q charges is not constant everywhere. It certainly is stronger in places close to the +4q or –q charge than it is midway between them. The field lines, therefore, should be drawn with a curved nature, similar (but not identical) to those that surround a dipole. Figure 18.28b shows more nearly correct representations of the field lines for the four charges.
Related Homework:
Problems 26, 55
|
 |
 Concept Simulation 18.2 Concept Simulation 18.2 |
 |
You can explore the electric field lines created by one or two point charges in this simulation. The magnitudes and algebraic signs of the charges are under your control, and either the field lines of the individual charges or the net field lines of both charges can be displayed. Related Homework: Problem 55 |
|
 |
 |
| Copyright © 2000-2003 by John Wiley & Sons, Inc. or related companies. All rights reserved. |


