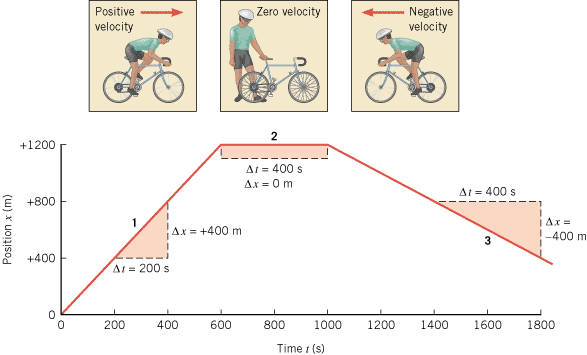
A bicyclist maintains a constant velocity on the outgoing leg of a trip, zero velocity while stopped, and another constant velocity on the way back. Figure 2.22 shows the corresponding position-time graph. Using the time and position intervals indicated in the drawing, obtain the velocities for each segment of the trip.
 |
|
Reasoning
The average velocity  is equal to the displacement Dx divided by the elapsed time
  . The displacement is the final position minus the initial position, which is a positive number for segment 1 and a negative number for segment 3. Note for segment 2 that Dx
![]() =
=![]() 0 m, since the bicycle is at rest. The drawing shows values for Dx and Dt for each of the three segments.
0 m, since the bicycle is at rest. The drawing shows values for Dx and Dt for each of the three segments.
Solution The average velocities for the three segments are
 |