16.9.
The Doppler Effect
Have you ever heard an approaching fire truck and noticed the distinct change in the sound of the siren as the truck passes? The effect is similar to what you get when you put together the two syllables “eee” and“ yow ” to produce “ eee-yow.”While the truck approaches, the pitch of the siren is relatively high (“eee”), but as the truck passes and moves away, the pitch suddenly drops (“yow”). Something similar, but less familiar, occurs when an observer moves toward or away from a stationary source of sound. Such phenomena were first identified in 1842 by the Austrian physicist Christian Doppler (1803–1853) and are collectively referred to as the Doppler effect.
 CONCEPTS AT A GLANCE To explain why the Doppler effect occurs, we will bring together concepts that we have discussed previously—namely, the velocity of an object and the wavelength and frequency of a sound wave (Section 16.5). As the Concepts-at-a-Glance chart in Figure 16.28 indicates, we will combine the effects of the velocities of the source and observer of the sound with the definitions of wavelength and frequency. In so doing, we will learn that the Doppler effect is the change in frequency or pitch of the sound detected by an observer because the sound source and the observer have different velocities with respect to the medium of sound propagation.
|
| Figure 16.28
CONCEPTS AT A GLANCE The Doppler effect arises when the source and the observer of the sound wave have different velocities with respect to the medium through which the sound travels. At a racing event, the Doppler effect creates the characteristic sound that you hear when the cars pass by. It is similar to that heard when a train blowing its horn passes you at a high speed. (© Simon Bruty/Stone/Getty Imates) |
|
MOVING SOURCE
To see how the Doppler effect arises, consider the sound emitted by a siren on the stationary fire truck in Figure 16.29a. Like the truck, the air is assumed to be stationary with respect to the earth. Each solid blue arc in the drawing represents a condensation of the sound wave. Since the sound pattern is symmetrical, listeners standing in front of or behind the truck detect the same number of condensations per second and, consequently, hear the same frequency. Once the truck begins to move, the situation changes, as part b of the picture illustrates. Ahead of the truck, the condensations are now closer together, resulting in a decrease in the wavelength of the sound. This “bunching-up” occurs because the moving truck “gains ground” on a previously emitted condensation before emitting the next one. Since the condensations are closer together, the observer standing in front of the truck senses more of them arriving per second than she does when the truck is stationary. The increased rate of arrival corresponds to a greater sound frequency, which the observer hears as a higher pitch. Behind the moving truck, the condensations are farther apart than they are when the truck is stationary. This increase in the wavelength occurs because the truck pulls away from condensations emitted toward the rear. Consequently, fewer condensations per second arrive at the ear of an observer behind the truck, corresponding to a smaller sound frequency or lower pitch.
 | | Figure 16.29
(a) When the truck is stationary, the wavelength of the sound is the same in front of and behind the truck. (b) When the truck is moving, the wavelength in front of the truck becomes smaller, while the wavelength behind the truck becomes larger. |
|
If the stationary siren in Figure 16.29a emits a condensation at the time t =0 s, it will emit the next one at time T, where T is the period of the wave. The distance between these two condensations is the wavelength l of the sound produced by the stationary source, as Figure 16.30a indicates. When the truck is moving with a speed vs (the subscript “s” stands for the “source” of sound) toward a stationary observer, the siren also emits condensations at t=0 s and at time T. However, prior to emitting the second condensation, the truck moves closer to the observer by a distance vsT, as Figure 16.30b shows. As a result, the distance between successive condensations is no longer the wavelength l created by the stationary siren, but, rather, a wavelength l' that is shortened by the amount vsT:
 | |
 | | Figure 16.30
(a) When the fire truck is stationary, the distance between successive condensations is one wavelength l. (b) When the truck moves with a speed v
s, the wavelength of the sound in front of the truck is shortened to l
'. |
|
Let’s denote the frequency perceived by the stationary observer as fo, where the subscript “o” stands for “observer.” According to Equation 16.1, fo is equal to the speed of sound v divided by the shortened wavelength l':
But for the stationary siren, we have l=v/fs and T=1/fs, where fs is the frequency of the sound emitted by the source (not the frequency fo perceived by the observer). With the aid of these substitutions for l and T, the expression for fo can be arranged to give the following result:
 | (16.11) | |
Since the term 1–vs/v is in the denominator in Equation 16.11 and is less than one, the frequency fo heard by the observer is greater than the frequency fs emitted by the source. The difference between these two frequencies, fo–fs, is called the Doppler shift, and its magnitude depends on the ratio of the speed of the source vs to the speed of sound v.
When the siren moves away from, rather than toward, the observer, the wavelength l' becomes greater than l according to
Notice the presence of the “+” sign in this equation, in contrast to the “–” sign that appeared earlier. The same reasoning that led to Equation 16.11 can be used to obtain an expression for the observed frequency fo:
 | (16.12) | |
The denominator 1+vs/v in Equation 16.12 is greater than one, so the frequency fo heard by the observer is less than the frequency fs emitted by the source. The next example illustrates how large the Doppler shift is in a familiar situation.
| Example 10 The Sound of a Passing Train |
 |
|
A high-speed train is traveling at a speed of 44.7 m/s (100 mi/h) when the engineer sounds the 415-Hz warning horn. The speed of sound is 343 m/s. What are the frequency and wavelength of the sound, as perceived by a person standing at a crossing, when the train is (a) approaching and (b) leaving the crossing?
Reasoning
When the train approaches, the person at the crossing hears a sound whose frequency is greater than 415 Hz because of the Doppler effect. As the train moves away, the person hears a frequency that is less than 415 Hz. We may use Equations 16.11 and 16.12, respectively, to determine these frequencies. In either case, the observed wavelength can be obtained according to Equation 16.1 as the speed of sound divided by the observed frequency.
Solution
| (a) |
When the train approaches, the observed frequency is
 | (16.11) | |
The observed wavelength is
 | (16.1) | |
| | (b) |
When the train leaves the crossing, the observed frequency is
 | (16.12) | |
In this case, the observed wavelength is
|
|
 |
|
 Interactive LearningWare 16.2 Interactive LearningWare 16.2 | A screeching hawk flies directly toward a bird-watcher at a speed of 11.0 m/s. The frequency heard by the stationary bird-watcher is 894 Hz when the speed of sound is 343 m/s. What is the frequency heard by the bird-watcher when the hawk flies away from the watcher at the same speed? Related Homework: Problem 84 |
|
|
MOVING OBSERVER
Figure 16.31 shows how the Doppler effect arises when the sound source is stationary and the observer moves, again assuming the air is stationary. The observer moves with a speed vo (“o” stands for “observer”) toward the stationary source and covers a distance vot in a time t. During this time, the moving observer encounters all the condensations that he would if he were stationary, plus an additional number. The additional number of condensations encountered is the distance vot divided by the distance l between successive condensations, or vot/l. Thus, the additional number of condensations encountered per second is vo/l. Since a stationary observer would hear a frequency fs emitted by the source, the moving observer hears a higher frequency fo given by
 | | Figure 16.31
An observer moving with a speed v
o toward the stationary source intercepts more wave condensations per unit of time than does a stationary observer. |
|
Using the fact that v=fsl, we find that
 | (16.13) | |
An observer moving away from a stationary source moves in the same direction as the sound wave and, as a result, intercepts fewer condensations per second than a stationary observer does. In this case, the moving observer hears a smaller frequency fo that is given by
 | (16.14) | |
The physical mechanism producing the Doppler effect in the case of the moving observer is different from that in the case of the moving source. When the source moves and the observer is stationary, the wavelength l in Figure 16.30b changes, giving rise to the frequency fo heard by the observer. On the other hand, when the observer moves and the source is stationary, the wavelength l in Figure 16.31 does not change. Instead, a moving observer intercepts a different number of wave condensations per second than does a stationary observer and, therefore, detects a different frequency fo.
GENERAL CASE
It is possible for both the sound source and the observer to move with respect to the medium of sound propagation. If the medium is stationary, Equations 16.11 –16.14 may be combined to give the observed frequency fo as
 | (16.15) | |
In the numerator, the plus sign applies when the observer moves toward the source, and the minus sign applies when the observer moves away from the source. In the denominator, the minus sign is used when the source moves toward the observer, and the plus sign is used when the source moves away from the observer. The symbols vo, vs, and v denote numbers without an algebraic sign because the direction of travel has been taken into account by the plus and minus signs that appear directly in this equation.
| Check Your Understanding 4 |
|
|
When a truck is stationary, its horn produces a frequency of 500 Hz. You are driving your car, and this truck is following behind. You hear its horn at a frequency of 520 Hz. (a) Who is driving faster, you or the truck driver, or are you and the truck driver driving at the same speed? (b) Refer to Equation 16.15 and decide which algebraic sign is to be used in the numerator and which in the denominator.
Background:
The Doppler effect is the key here. However, the motions of both the car and the truck influence the effect. Furthermore, the effect of one motion can partially or totally offset the effect of the other motion, depending on the speeds of the car and the truck.
For similar questions (including calculational counterparts), consult Self-Assessment Test 16.2. The test is described at the end of this section.
|
|
|
NEXRAD
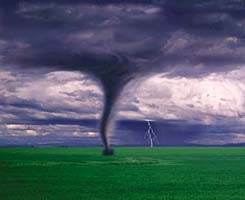
NEXRAD stands for Next Generation Weather Radar and is a nationwide system used by the National Weather Service to provide dramatically improved early warning of severe storms, such as the tornado in Figure 16.32. The system is based on radar waves, which are a type of electromagnetic wave (see Chapter 24) and, like sound waves, can exhibit the Doppler effect. The Doppler effect is at the heart of NEXRAD. As the drawing illustrates, a tornado is a swirling mass of air and water droplets. Radar pulses are sent out by a NEXRAD unit, whose protective covering is shaped like a soccer ball. The waves reflect from the water droplets and return to the unit, where the frequency is observed and compared to the outgoing frequency. For instance, droplets at point A in the drawing are moving toward the unit, and the radar waves reflected from them have their frequency Doppler-shifted to higher values. Droplets at point B, however, are moving away from the unit. The frequency of the waves reflected from these droplets is Doppler-shifted to lower values. Computer processing of the Doppler frequency shifts leads to color-enhanced views on display screens (see Figure 16.33). These views reveal the direction and magnitude of the wind velocity and can identify, from distances up to 140 mi, the swirling air masses that are likely to spawn tornadoes. The equations that specify the Doppler frequency shifts are different from those given for sound waves by Equations 16.11–16.15. The reason for the difference is that radar waves propagate from one place to another by a different mechanism than that of sound waves (see Section 24.5).
|
| Figure 16.32
(a) A tornado is one of nature’s most dangerous storms. (b) The National Weather Service uses the NEXRAD system, which is based on Doppler-shifted radar, to identify the storms that are likely to spawn tornadoes. (© Paul and Lindamarie Ambrose/Taxi/Getty Images) |
|
 | | Figure 16.33
This color-enhanced NEXRAD view of a tornado shows winds moving toward (green) and away from (red) a NEXRAD station, which is below and to the right of the figure. The white dot and arrow indicate the the storm center and direction of wind circulation. (Courtesy Kurt Hondl, National Severe Storms Laboratory, Norman, OK.) |
|
| Self-Assessment Test 16.2 |
|
|
Check your understanding of the material in Sections 16.5, 16.6, 16.7, 16.8, and 16.9:
·The Nature of Sound, the Speed of Sound, and Sound Intensity ·Decibels ·The Doppler Effect
|
|
|
|
| Copyright © 2000-2003 by John Wiley & Sons, Inc. or related companies. All rights reserved. |