| 2-10 Graphical Integration in Motion Analysis | ||
When we have a graph of an object's acceleration versus time, we can integrate on the graph to find the object's velocity at any given time. Because acceleration a is defined in terms of velocity as a = dv/dt, the Fundamental Theorem of Calculus tells us that
 | (2-22) |
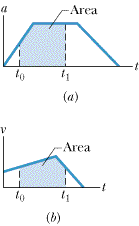
The right side of the equation is a definite integral (it gives a numerical result rather than a function), v0 is the velocity at time t0, and v1 is the velocity at later time t1. The definite integral can be evaluated from an a(t) graph, such as in Figure 2-12a. In particular,
 | (2-23) |
 |
| Fig. 2-12 The area between a plotted curve and the horizontal time axis, from time t0 to time t1, is indicated for (a) a graph of acceleration a versus t and (b) a graph of velocity v versus t. |
If a unit of acceleration is 1 m/s2 and a unit of time is 1 s, then the corresponding unit of area on the graph is
 |
which is (properly) a unit of velocity. When the acceleration curve is above the time axis, the area is positive; when the curve is below the time axis, the area is negative.
Similarly, because velocity v is defined in terms of the position x as v = dx/dt, then
 | (2-24) |
where x0 is the position at time t0 and x1 is the position at time t1. The definite integral on the right side of Equation 2-24 can be evaluated from a v(t) graph, like that shown in Figure 2-12b. In particular,
 | (2-25) |
If the unit of velocity is 1 m/s and the unit of time is 1 s, then the corresponding unit of area on the graph is
 |
which is (properly) a unit of position and displacement. Whether this area is positive or negative is determined as described for the a(t) curve of Figure 2-12a.
|
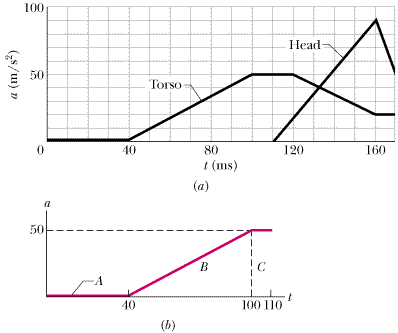
In one test to study neck injury in rear-end collisions, a volunteer was strapped to a seat that was then moved abruptly to simulate a collision by a rear car moving at 10.5 km/h. Figure 2-13a gives the accelerations of the volunteer's torso and head during the collision, which began at time t = 0. The torso acceleration was delayed by 40 ms because during that time interval the seat back had to compress against the volunteer. The head acceleration was delayed by an additional 70 ms. What was the torso speed when the head began to accelerate?
 |
| Fig. 2-13 (a) The a(t) curve of the torso and head of a volunteer in a simulation of a rear-end collision. (b) Breaking up the region between the plotted curve and the time axis to calculate the area. |
Solution: The Key Idea here is that we can calculate the torso speed at any time by finding an area on the torso a(t) graph. We know that the initial torso speed is v0 = 0 at time t0 = 0, at the start of the “collision.” We want the torso speed v1 at time t1 = 110 ms, which is when the head begins to accelerate.
Combining Equation 2-22 and Equation 2-23, we can write
 | (2-26) |
For convenience, let us separate the area into three regions (Figure 2-13b). From 0 to 40 ms, region A has no area:
 |
From 40 ms to 100 ms, region B has the shape of a triangle, with area
 |
From 100 ms to 110 ms, region C has the shape of a rectangle, with area
 |
Substituting these values and v0 = 0 into Equation 2-26 gives us
 |
or
 | (Answer) |
When the head is just starting to move forward, the torso already has a speed of 7.2 km/h. Researchers argue that it is this difference in speeds during the early stage of a rear-end collision that injures the neck. The backward whipping of the head happens later and could, especially if there is no head restraint, increase the injury.
2.61 Interactive Learningware |