Graphical techniques are helpful in understanding the concepts of velocity and acceleration. Suppose a bicyclist is riding with a constant velocity of v =
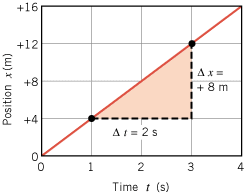
= +4 m/s. The position x of the bicycle can be plotted along the vertical axis of a graph, while the time t is plotted along the horizontal axis. Since the position of the bike increases by 4 m every second, the graph of x versus t is a straight line. Furthermore, if the bike is assumed to be at x
 =
= 0 m when t
 =
= 0 s, the straight line passes through the origin, as Figure 2.21 shows. Each point on this line gives the position of the bike at a particular time. For instance, at t
 =
= 1 s the position is 4 m, while at t
 =
= 3 s the position is 12 m.
 | Figure 2.21
A graph of position vs. time for an object moving with a constant velocity of v = = Dx/Dt Dx/Dt = = +4 m/s. +4 m/s. |
|
In constructing the graph in Figure 2.21, we used the fact that the velocity was +4 m/s. Suppose, however, that we were given this graph, but did not have prior knowledge of the velocity. The velocity could be determined by considering what happens to the bike between the times of 1 and 3 s, for instance. The change in time is Dt =
= 2 s. During this time interval, the position of the bike changes from +4 to +12 m, and the change in position is Dx
 =
= +8 m. The ratio Dx/Dt is called the slope of the straight line.
 |  |
Notice that the slope is equal to the velocity of the bike. This result is no accident, because Dx/Dt is the definition of average velocity (see Equation 2.2). Thus, for an object moving with a constant velocity, the slope of the straight line in a position-time graph gives the velocity. Since the position-time graph is a straight line, any time interval Dt can be chosen to calculate the velocity. Choosing a different Dt will yield a different Dx, but the velocity Dx/Dt will not change. In the real world, objects rarely move with a constant velocity at all times, as the next example illustrates.
| Example 16 A Bicycle Trip |
 |
|
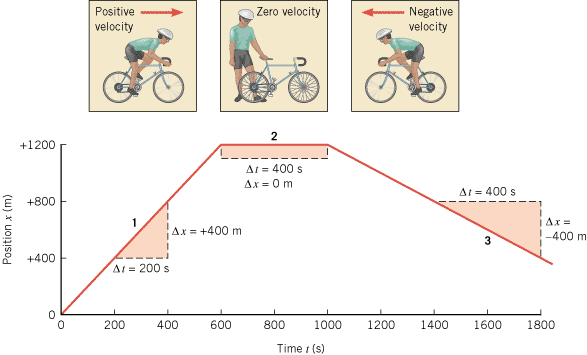
A bicyclist maintains a constant velocity on the outgoing leg of a trip, zero velocity while stopped, and another constant velocity on the way back. Figure 2.22 shows the corresponding position-time graph. Using the time and position intervals indicated in the drawing, obtain the velocities for each segment of the trip.
 | | Figure 2.22
This position-vs.-time graph consists of three straight-line segments, each corresponding to a different constant velocity. |
|
Reasoning
The average velocity  is equal to the displacement Dx divided by the elapsed time is equal to the displacement Dx divided by the elapsed time  . The displacement is the final position minus the initial position, which is a positive number for segment 1 and a negative number for segment 3. Note for segment 2 that Dx . The displacement is the final position minus the initial position, which is a positive number for segment 1 and a negative number for segment 3. Note for segment 2 that Dx = = 0 m, since the bicycle is at rest. The drawing shows values for Dx and Dt for each of the three segments. 0 m, since the bicycle is at rest. The drawing shows values for Dx and Dt for each of the three segments.
Solution
The average velocities for the three segments are
In the second segment of the journey the velocity is zero, reflecting the fact that the bike is stationary. Since the position of the bike does not change, segment 2 is a horizontal line that has a zero slope. In the third part of the motion the velocity is negative, because the position of the bike decreases from x = = +800 m to x +800 m to x = = +400 m during the 400-s interval shown in the graph. As a result, segment 3 has a negative slope, and the velocity is negative. +400 m during the 400-s interval shown in the graph. As a result, segment 3 has a negative slope, and the velocity is negative.
|
 |
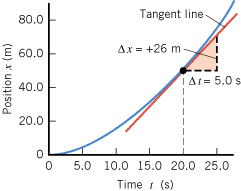
If the object is accelerating, its velocity is changing. When the velocity is changing, the x-versus-t graph is not a straight line, but is a curve, perhaps like that in Figure 2.23. This curve was drawn using Equation 2.8,  assuming an acceleration of a
 =
= 0.26 m/s2 and an initial velocity of v0
 =
= 0 m/s. The velocity at any instant of time can be determined by measuring the slope of the curve at that instant. The slope at any point along the curve is defined to be the slope of the tangent line drawn to the curve at that point. For instance, in Figure 2.23 a tangent line is drawn at t
 =
= 20.0 s. To determine the slope of the tangent line, a triangle is constructed using an arbitrarily chosen time interval of Dt
 =
= 5.0 s. The change in x associated with this time interval can be read from the tangent line as Dx
 =
= +26 m. Therefore,
 |  |
The slope of the tangent line is the instantaneous velocity, which in this case is v =
= +5.2 m/s. This graphical result can be verified by using Equation 2.4 with v0
 =
= 0 m/s: v
 =
= at
at =
= (+0.26 m/s2)(20.0 s)
 =
= +5.2 m/s.
 | | Figure 2.23
When the velocity is changing, the position-vs.-time graph is a curved line. The slope D
x/D
t of the tangent line drawn to the curve at a given time is the instantaneous velocity at that time. |
|
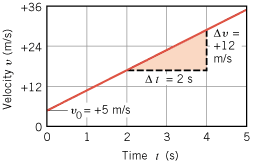
Insight into the meaning of acceleration can also be gained with the aid of a graphical representation. Consider an object moving with a constant acceleration of a =
= +6 m/s2. If the object has an initial velocity of v0
 =
= +5 m/s, its velocity at any time is represented by Equation 2.4 as
This relation is plotted as the velocity-versus-time graph in Figure 2.24. The graph of v versus t is a straight line that intercepts the vertical axis at v0 =
= 5 m/s. The slope of this straight line can be calculated from the data shown in the drawing:
The ratio Dv/Dt is, by definition, equal to the average acceleration (Equation 2.4), so the slope of the straight line in a velocity-time graph is the average acceleration.
 | Figure 2.24
A velocity-vs.-time graph that applies to an object with an acceleration of Dv/Dt = = +6 m/s2. The initial velocity is v0 +6 m/s2. The initial velocity is v0 = = +5 m/s when t +5 m/s when t = = 0 s. 0 s. |
|
 Concept Simulation 2.4 Concept Simulation 2.4 |
 |
This simulation constructs the position-versus-time and velocity-versus-time graphs for a moving cart, according to your choice of values for the initial position, initial velocity, and acceleration. The graphs are created in synch with the cart’s motion. Related Homework: Problem 64 |
|
 |
 |
|
Test your understanding of the material in Sections 2.6 and 2.7:
·Freely Falling Bodies · Graphical Analysis of Velocity and Acceleration
|
|
 |
 |
| Copyright © 2000-2003 by John Wiley & Sons, Inc. or related companies. All rights reserved. |
![]() =
=![]() +4 m/s. The position x of the bicycle can be plotted along the vertical axis of a graph, while the time t is plotted along the horizontal axis. Since the position of the bike increases by 4 m every second, the graph of x versus t is a straight line. Furthermore, if the bike is assumed to be at x
+4 m/s. The position x of the bicycle can be plotted along the vertical axis of a graph, while the time t is plotted along the horizontal axis. Since the position of the bike increases by 4 m every second, the graph of x versus t is a straight line. Furthermore, if the bike is assumed to be at x![]() =
=![]() 0 m when t
0 m when t![]() =
=![]() 0 s, the straight line passes through the origin, as Figure 2.21 shows. Each point on this line gives the position of the bike at a particular time. For instance, at t
0 s, the straight line passes through the origin, as Figure 2.21 shows. Each point on this line gives the position of the bike at a particular time. For instance, at t![]() =
=![]() 1 s the position is 4 m, while at t
1 s the position is 4 m, while at t![]() =
=![]() 3 s the position is 12 m.
3 s the position is 12 m.
![]() =
=![]() 2 s. During this time interval, the position of the bike changes from +4 to +12 m, and the change in position is Dx
2 s. During this time interval, the position of the bike changes from +4 to +12 m, and the change in position is Dx![]() =
=![]() +8 m. The ratio Dx/Dt is called the slope of the straight line.
+8 m. The ratio Dx/Dt is called the slope of the straight line.
 assuming an acceleration of a
![]() =
=![]() 0.26 m/s2 and an initial velocity of v0
0.26 m/s2 and an initial velocity of v0![]() =
=![]() 0 m/s. The velocity at any instant of time can be determined by measuring the slope of the curve at that instant. The slope at any point along the curve is defined to be the slope of the tangent line drawn to the curve at that point. For instance, in Figure 2.23 a tangent line is drawn at t
0 m/s. The velocity at any instant of time can be determined by measuring the slope of the curve at that instant. The slope at any point along the curve is defined to be the slope of the tangent line drawn to the curve at that point. For instance, in Figure 2.23 a tangent line is drawn at t![]() =
=![]() 20.0 s. To determine the slope of the tangent line, a triangle is constructed using an arbitrarily chosen time interval of Dt
20.0 s. To determine the slope of the tangent line, a triangle is constructed using an arbitrarily chosen time interval of Dt![]() =
=![]() 5.0 s. The change in x associated with this time interval can be read from the tangent line as Dx
5.0 s. The change in x associated with this time interval can be read from the tangent line as Dx![]() =
=![]() +26 m. Therefore,
+26 m. Therefore,
![]() =
=![]() +5.2 m/s. This graphical result can be verified by using Equation 2.4 with v0
+5.2 m/s. This graphical result can be verified by using Equation 2.4 with v0![]() =
=![]() 0 m/s: v
0 m/s: v![]() =
=![]() at
at![]() =
=![]() (+0.26 m/s2)(20.0 s)
(+0.26 m/s2)(20.0 s)![]() =
=![]() +5.2 m/s.
+5.2 m/s.
![]() =
=![]() +6 m/s2. If the object has an initial velocity of v0
+6 m/s2. If the object has an initial velocity of v0![]() =
=![]() +5 m/s, its velocity at any time is represented by Equation 2.4 as
+5 m/s, its velocity at any time is represented by Equation 2.4 as
![]() =
=![]() 5 m/s. The slope of this straight line can be calculated from the data shown in the drawing:
5 m/s. The slope of this straight line can be calculated from the data shown in the drawing:

 Concept Simulation 2.4