Additional Problems

42.   Kids in the Back! An unrestrained child is playing on the front seat of a car that is traveling in a residential neighborhood at 35 km/h. (How many mi/h is this? Is this car going too fast?) A small dog runs across the road and the driver applies the brakes, stopping the car quickly and missing the dog. Estimate the speed with which the child strikes the dashboard, presuming that the car stops before the child does so. Compare this speed with that of the world-record 100 m dash, which is run in about 10 s.

43.   The Passat GLX Test results (Car & Driver, February 1993, p. 48) on a Volkswagen Passat GLX show that when the brakes are fully applied it has an average braking acceleration of magnitude 8.9 m/s2. If a preoccupied driver who is moving at a speed of 42 mph looks up suddenly and sees a stop light 30 m in front of him, will he have sufficient time to stop? The weight of the Volkswagen is 3 152 lb.

44.   Velocity and Pace When we drive a car we usually describe our motion in terms of speed or velocity. A speed limit, such as 60 mi/h, is a speed. When runners or joggers describe their motion, they often do so in terms of a pace—how long it takes to go a given distance. A 4–min mile (or better,“4 minutes/mile”) is an example of a pace.

(a)  

Express the speed 60 mi/h as a pace in min/mi.

(b)  

I walk on my treadmill at a pace of 17 min/mi. What is my speed in mi/h?

(c)  

If I travel at a speed, v, given in mi/h, what is my pace, p, given in min/mi? (Write an equation that would permit easy conversion.)

45.   Spirit of America The 9000 lb Spirit of America (designed to be the world's fastest car) accelerated from rest to a final velocity of 756 mph in a time of 45 s.What would the acceleration have been in meters per second? What distance would the driver, Craig Breedlove, have covered?

46.   Driving to New York You and a friend decide to drive to New York from College Park, Maryland (near Washington, D.C.) on Saturday over the Thanksgiving break to go to a concert with some friends who live there. You figure you have to reach the vicinity of the city at 5 P.M. in order to meet your friends in time for dinner before the concert. It's about 220 mi from the entrance to Route 95 to the vicinity of New York City.You would like to get on the highway about noon and stop for a bite to eat along the way.What does your average velocity have to be? If you keep an approximately constant speed (not a realistic assumption!), what should your speedometer read while you are driving?

47.   NASA Internship You are working as a student intern for the National Aeronautics and Space Administration (NASA) and your supervisor wants you to perform an indirect calculation of the upward velocity of the space shuttle relative to the Earth's surface just 5.5 s after it is launched when it has an altitude of 100 m. In order to obtain data, one of the engineers has wired a streamlined flare to the side of the shuttle that is gently released by remote control after 5.5 s. If the flare hits the ground 8.5 s after it is released, what is the upward velocity of the flare (and hence of the shuttle) at the time of its release? (Neglect any effects of air resistance on the flare.) Note: Although the flare idea is fictional, the data on a typical shuttle altitude and velocity at 5.5 s are straight from NASA!

48.   Cell Phone Fight You are arguing over a cell phone while trailing an unmarked police car by 25 m; both your car and the police car are traveling at 110 km/h.Your argument diverts your attention from the police car for 2.0 s (long enough for you to look at the phone and yell, “I won't do that!”). At the beginning of that 2.0 s, the police officer begins emergency braking at 5.0 m/s2. (a) What is the separation between the two cars when your attention finally returns? Suppose that you take another 0.40 s to realize your danger and begin braking. (b) If you too brake at 5.0 m/s2, what is your speed when you hit the police car?

49.   Reaction Distance When a driver brings a car to a stop by braking as hard as possible, the stopping distance can be regarded as the sum of a “reaction distance,” which is initial speed multiplied by the driver's reaction time, and a “braking distance,” which is the distance traveled during braking. The following table gives typical values. (a) What reaction time is the driver assumed to have? (b) What is the car's stopping distance if the initial speed is 25 m/s?

50.   Tailgating In this problem we analyze the phenomenon of “tailgating” in a car on a highway at high speeds. This means traveling too close behind the car ahead of you. Tailgating leads to multiple car crashes when one of the cars in a line suddenly slows down. The question we want to answer is: “How close is too close?”

To answer this question, let's suppose you are driving on the highway at a speed of 100 km/h (a bit more than 60 mi/h). The driver ahead of you suddenly puts on his brakes. We need to calculate a number of things: how long it takes you to respond; how far you travel in that time, and how far the other car travels in that time.
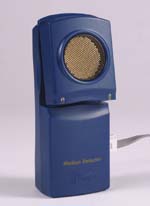
(a)  

First let's estimate how long it takes you to respond. Two times are involved: how long it takes from the time you notice something happening till you start to move to the brake, and how long it takes to move your foot to the brake. You will need a ruler to do this. Take the ruler and have a friend hold it from the one end hanging straight down. Place your thumb and forefinger opposite the bottom of the ruler. As your friend releases the ruler suddenly, try to catch it with your thumb and forefinger. Measure how far it falls before you catch it. Do this three times and take the average distance. Assuming the ruler is falling freely without air resistance (not a bad assumption), calculate how much time it takes you to catch it, t1. Now estimate the time, t2, it takes you to move your foot from the gas pedal to the brake pedal.Your reaction time is t1 + t2.

(b)  

If you brake hard and fast, you can bring a typical car to rest from 100 km/h (about 60 mi/h) in 5 seconds.

1.

Calculate your acceleration,–a0, assuming that it is constant.

2.

Suppose the driver ahead of you begins to brake with an accelerationa0. How far will he travel before he comes to a stop? (Hint: How much time will it take him to stop? What will be his average velocity over this time interval?)

(c)  

Now we can put these results together into a fairly realistic situation. You are driving on the highway at 100 km/hr and there is a driver in front of you going at the same speed.

1.

You see him start to slow immediately (an unreasonable but simplifying assumption). If you are also traveling 100 km/h, how far (in meters) do you travel before you begin to brake? If you can also produce the accelerationa0 when you brake, what will be the total distance you travel before you come to a stop?

2.

If you don't notice the driver ahead of you beginning to brake for 1 s, how much additional distance will you travel?

3.

Discuss, on the basis of these calculations, what you think is a safe distance to stay behind a car at 60 mi/h. Express your distance in “car lengths” (about 15 ft).Would you include a safety factor beyond what you have calculated here? How much?

51.   Testing the Motion Detector A motion detector that may be used in physics laboratories is shown in Fig. 2-30. It measures the distance to the nearest object by using a speaker and a microphone. The speaker clicks 30 times a second. The microphone detects the sound bouncing back from the nearest object in front of it. The computer calculates the time delay between making the sound and receiving the echo. It knows the speed of sound (about 343 m/s at room temperature), and from that it can calculate the distance to the object from the time delay.
Figure 2-30 Problem 51.

(a)  

If the nearest object in front of the detector is too far away, the echo will not get back before a second click is emitted. Once that happens, the computer has no way of knowing that the echo isn't an echo from the second click and that the detector isn't giving correct results any more. How far away does the object have to be before that happens?

(b)  

The speed of sound changes a little bit with temperature. Let's try to get an idea of how important this is. At room temperature (72 °F) the speed of sound is about 343 m/s. At 62 °F it is about 1% smaller. Suppose we are measuring an object that is really 1.5 meters away at 72 °F. What is the time delay Dt that the computer detects before the echo returns? Now suppose the temperature is 62 °F. If the computer detects a time delay of Dt but (because it doesn't know the temperature) calculates the distance using the speed of sound appropriate for 72 °F, how far away does the computer report the object to be?

52.   Hitting a Bowling Ball A bowling ball sits on a hard floor at a point that we take to be the origin. The ball is hit some number of times by a hammer.The ball moves along a line back and forth across the floor as a result of the hits. (See Fig. 2-31.) The region to the right of the origin is taken to be positive, but during its motion the ball is at times on both sides of the origin. After the ball has been moving for a while, a motion detector like the one discussed in Problem 51 is started and takes the following graph of the ball's velocity.
Figure 2-31 Problem 52.

Answer the following questions with the symbols L (left), R (right), N (neither), or C (can't say which). Each question refers only to the time interval displayed by the computer.

(a)  

At which side of the origin is the ball for the time marked A?

(b)  

At the time marked B, in which direction is the ball moving?

(c)  

Between the times A and C, what is the direction of the ball's displacement?

(d)  

The ball receives a hit at the time marked D. In what direction is the ball moving after that hit?

53.   Waking the Balrog In The Fellowship of the Ring, the hobbit Peregrine Took (Pippin for short) drops a rock into a well while the travelers are in the caves of Moria. This wakes a balrog (a bad thing) and causes all kinds of trouble. Pippin hears the rock hit the water 7.5 s after he drops it.

(a)  

Ignoring the time it takes the sound to get back up, how deep is the well?

(b)  

It is quite cool in the caves of Moria, and the speed of sound in air changes with temperature. Take the speed of sound to be 340 m/s (it is pretty cool in that part of Moria).Was it OK to ignore the time it takes sound to get back up? Discuss and support your answer with a calculation.

54.   Two Balls, Passing in the Night* Figure 2-32 represents the position vs. clock reading of the motion of two balls, A and B, moving on parallel tracks. Carefully sketch the figure on your homework paper and answer the following questions:

(a)  

Along the t axis, mark with the symbol tA any instant or instants at which one ball is passing the other.

(b)  

Which ball is moving faster at clock reading tB?

(c)  

Mark with the symbol tC any instant or instants at which the balls have the same velocity.

(d)  

Over the period of time shown in the diagram, which of the following is true of ball B? Explain your answer.

1.

It is speeding up all the time.

2.

It is slowing down all the time.

3.

It is speeding up part of the time and slowing down part of the time.


Figure 2-32 Problem 54.

55.   Graph for a Cart on a Tilted Airtrack—with Spring The graph in Fig. 2-33 below shows the velocity graph of a cart moving on an air track. The track has a spring at one end and has its other end raised. The cart is started sliding up the track by pressing it against the spring and releasing it. The clock is started just as the cart leaves the spring.Take the direction the cart is moving in initially to be the positive x direction and take the bottom of the spring to be the origin.
Figure 2-33 Problem 55.

Letters point to six points on the velocity curve. For the physical situations described below, identify which of the letters corresponds to the situation described. You may use each letter more than once, more than one letter may be used for each answer, or none may be appropriate. If none is appropriate, use the letter N.

(a)  

This point occurs when the cart is at its highest point on the track.

(b)  

At this point, the cart is instantaneously not moving.

(c)  

This is a point when the cart is in contact with the spring.

(d)  

At this point, the cart is moving down the track toward the origin.

(e)  

At this point, the cart has acceleration of zero.

56.   Rolling Up and Down A ball is launched up a ramp by a spring as shown in Fig. 2-34. At the time when the clock starts, the ball is near the bottom of the ramp and is rolling up the ramp as shown. It goes to the top and then rolls back down. For the graphs shown in Fig. 2-34, the horizontal axis represents the time. The vertical axis is unspecified.
Figure 2-34 Problem 56.

For each of the following quantities, select the letter of the graph that could provide a correct graph of the quantity for the ball in the situation shown (if the vertical axis were assigned the proper units). Use the x and y coordinates shown in the picture. If none of the graphs could work, write N.

(a)  

The x-component of the ball's position ______

(b)  

The y-component of the ball's velocity ______

(c)  

The x-component of the ball's acceleration ______

(d)  

The y-component of the normal force the ramp exerts on the ball ______

(e)  

The x-component of the ball's velocity ______

(f)  

The x-component of the force of gravity acting on the ball ______

57.   Model Rocket A model rocket, propelled by burning fuel, takes off vertically. Plot qualitatively (numbers not required) graphs of y, v, and a versus t for the rocket's flight. Indicate when the fuel is exhausted, when the rocket reaches maximum height, and when it returns to the ground.

58.   Rock Climber At time t = 0, a rock climber accidentally allows a piton to fall freely from a high point on the rock wall to the valley below him. Then, after a short delay, his climbing partner, who is 10 m higher on the wall, throws a piton downward. The positions y of the pitons versus t during the fall are given in Fig. 2-35. With what speed was the second piton thrown?
Figure 2-35 Problem 58.

59.   Two Trains As two trains move along a track, their conductors suddenly notice that they are headed toward each other. Figure 2-36 gives their velocities v as functions of time t as the conductors slow the trains. The slowing processes begin when the trains are 200 m apart. What is their separation when both trains have stopped?
Figure 2-36 Problem 59.

60.   Runaway Balloon As a runaway scientific balloon ascends at 19.6 m/s, one of its instrument packages breaks free of a harness and free-falls. Figure 2-37 gives the vertical velocity of the package versus time, from before it breaks free to when it reaches the ground. (a) What maximum height above the break-free point does it rise? (b) How high was the break-free point above the ground?
Figure 2-37 Problem 60.

61.   Position Function Two A particle moves along the x axis with position function x(t) as shown in Fig. 2-38. Make rough sketches of the particle's velocity versus time and its acceleration versus time for this motion.
Figure 2-38 Problem 61.

62.   Velocity Curve Figure 2-39 gives the velocity v(m/s) versus time t (s) for a particle moving along an x axis. The area between the time axis and the plotted curve is given for the two portions of the graph. At t = tA (at one of the crossing points in the plotted figure), the particle's position is x = 14 m. What is its position at (a) t = 0 and (b) t = tB?
Figure 2-39 Problem 62.

63.   The Motion Detector Rag This assignment is based on the Physics Pholk Song CD distributed by Pasco scientific. These songs are also available through the Dickinson College Web site at http://physics.dickinson.edu.

(a)  

Refer to the motion described in the first verse of the Motion Detector Rag; namely, you are moving for the same amount of time that you are standing. Sketch a position vs. time graph for this motion. Also, describe the shape of the graph in words.

(b)  

Refer to the motion described in the second verse of the Motion Detector Rag. In this verse, you are making a “steep downslope,” then a “gentle up-slope,” and last a flat line. You spend the same amount of time engaged in each of these actions. Sketch a position vs. time graph of this motion. Also, describe what you are doing in words. That is, are you standing still, moving away from the origin (or motion detector), moving toward the origin (or motion detector)? Which motion is the most rapid, and so on?

(c)  

Refer to the motion described in the third verse of the Motion Detector Rag. You start from rest and move away from the motion detector at an acceleration of +1.0 m/s2 for 5 seconds. Sketch the acceleration vs. time graph to this motion. Sketch the corresponding velocity vs. time graph. Sketch the shape of the corresponding position vs. time graph.

64.   Hockey Puck At time t = 0, a hockey puck is sent sliding over a frozen lake, directly into a strong wind. Figure 2-40 gives the velocity v of the puck vs. time, as the puck moves along a single axis. At t = 14 s, what is its position relative to its position at t = 0?
Figure 2-40 Problem 64.

65.   Describing One-Dimensional Velocity Changes In each of the following situations you will be asked to refer to the mathematical definitions and the concepts associated with the number line. Note that being more positive is the same as being less negative, and so on.

(a)  

Suppose an object undergoes a change in velocity from +1 m/s to +4 m/s. Is its velocity becoming more positive or less positive? What is meant by more positive? Less positive? Is the acceleration positive or negative?

(b)  

Suppose an object undergoes a change in velocity from –4 m/s to –1 m/s. Is its velocity becoming more positive or less positive? What is meant by more positive? Less positive? Is the acceleration positive or negative?

(c)  

Suppose an object is turning around so that it undergoes a change in velocity from –2 m/s to +2 m/s. Is its velocity becoming more positive or less positive than it was before? What is meant by more positive? Less positive? Is it undergoing an acceleration while it is turning around? Is the acceleration positive or negative?

(d)  

Another object is turning around so that it undergoes a change in velocity from +1 m/s to –1 m/s. Is its velocity becoming more positive or less positive than it was before? What is meant by more positive? Less positive? Is it undergoing an acceleration while it is turning around? Is the acceleration positive or negative?

66.   Bowling Ball Graph A bowling ball was set into motion on a fairly smooth level surface, and data were collected for the total distance covered by the ball at each of four times. These data are shown in the table.

(a)  

Plot the data points on a graph.

(b)  

Use a ruler to draw a straight line that passes as close as possible to the data points you have graphed.

(c)  

Using methods you were taught in algebra, calculate the value of the slope, m, and find the value of the intercept, b, of the line you have sketched through the data.

Text Video

67.   Modeling Bowling Ball Motion A bowling ball is set into motion on a smooth level surface, and data were collected for the total distance covered by the ball at each of four times. These data are shown in the table in Problem 66. Your job is to learn to use a spreadsheet program — for example, Microsoft Excel—to create a mathematical model of the bowling ball motion data shown. You are to find what you think is the best value for the slope, m, and the y-intercept, b. Practicing with a tutorial worksheet entitled MODTUT.XLS will help you to learn about the process of modeling for a linear relationship. Ask your instructor where to find this tutorial worksheet.

After using the tutorial, you can create a model for the bowling ball data given above. To do this:

(a)  

Open a new worksheet and enter a title for your bowling ball graph.

(b)  

Set the y-label to Distance (m) and the x-label to Time (s).

(c)  

Refer to the data table above. Enter the measured times for the bowling ball in the Time (s) column (formerly x-label).

(d)  

Set the y-exp column to D-data (m) and enter the measured distances for the bowling ball (probably something like 0.00 m, 2.00 m, 4.00 m, and 6.00 m.).

(e)  

Place the symbol m (for slope) in the cell B1. Place the symbol b (for y-intercept) in cell B2.

(f)  

Set the y-theory column to D-model (m) and then put the appropriate equation for a straight line of the form Distance = m*Time + b in cells C7 through C12. Be sure to refer to cells C1 for slope and C2 for y-intercept as absolutes; that is, use $C$l and $C$2 when referring to them.

(g)  

Use the spreadsheet graphing feature to create a graph of the data in the D-exp and D-theory columns as a function of the data in the Time column.

(h)  

Change the values in cells Cl and C2 until your theoretical line matches as closely as possible your red experimental data points in the graph window.

(i)  

Discuss the meaning of the slope of a graph of distance vs. time. What does it tell you about the motion of the bowling ball?

Text Video

68.   A Strange Motion After doing a number of the exercises with carts and fans on ramps, it is easy to draw the conclusion that everything that moves is moving at either a constant velocity or a constant acceleration. Let's examine the horizontal motion of a triangular frame with a pendulum at its center that has been given a push. It undergoes an unusual motion. You should determine whether or not it is moving at either a constant velocity or constant acceleration. (Note: You may want to look at the motion of the triangular frame by viewing the digital movie entitled PASCO070. This movie is included on the VideoPoint compact disk. If you are not using VideoPoint, your instructor may make the movie available to you some other way.)

The images in Fig. 2-41 are taken from the 7th, 16th, and 25th frames of that movie.


Figure 2-41 Problem 68.

Data for the position of the center of the horizontal bar of the triangle were taken every tenth of a second during its first second of motion. The origin was placed at the zero centimeter mark of a fixed meter stick.These data are in the table below.

(a)  

Examine the position vs. time graph of the data shown above. Does the triangle appear to have a constant velocity throughout the first second? A constant acceleration? Why or why not?

(b)  

Discuss the nature of the motion based on the shape of the graph. At approximately what time, if any, is the triangle changing direction? At approximately what time does it have the greatest negative velocity? The greatest positive velocity? Explain the reasons for your answers.

(c)  

Use the data table and the definition of average velocity to calculate the average velocity of the triangle at each of the times between 0.100 s and 0.900 s. In this case you should use the position just before the indicated time and the position just after the indicated time in your calculation. For example, to calculate the average velocity at t2 = 0.100 seconds, use x3 = 44.5 cm and x1 = 52.1 cm along with the differences of the times at t3 and t1. Hint: Use only times and positions in the gray boxes to get a velocity in a gray box and use only times and positions in the white boxes to get a velocity in a white box.

(d)  

Since people usually refer to velocity as distance divided by time, maybe we can calculate the average velocities as simply x1/t1, x2/t2, x3/t3, and so on. This would be easier. Is this an equivalent method for finding the velocities at the different times? Try using this method of calculation if you are not sure. Give reasons for your answer.

(e)  

Often, when an oddly shaped but smooth graph is obtained from data it is possible to fit a polynomial to it. For example, a fourth-order polynomial that fits the data is

Using this polynomial approximation, find the instantaneous velocity at t = 0.700 s. Comment on how your answer compares to the average velocity you calculated at 0.700 s. Are the two values close? Is that what you expect?

Text Video

69.   Cedar Point At the Cedar Point Amusement Park in Ohio, a cage containing people is moving at a high initial velocity as the result of a previous free fall. It changes direction on a curved track and then coasts in a horizontal direction until the brakes are applied. This situation is depicted in a digital movie entitled DSON002. (Note: This movie is included on the VideoPoint compact disk. If you are not using VideoPoint, your instructor may make the movie available to you some other way.)

(a)  

Use video analysis software to gather data for the horizontal positions of the tail of the cage in meters as a function of time. Don't forget to use the scale on the title screen of the movie so your results are in meters rather than pixels. Summarize this data in a table or in a printout attached to your homework.

(b)  

Transfer your data to a spreadsheet and do a parabolic model to show that within 5% or better x = (–7.5 m/s2)t2+(22.5 m/s)t + 2.38 m. Please attach a printout of this model and graph with your name on it to your submission as “proof of completion.” (Note: Your judgments about the location of the cage tail may lead to slightly different results.)

(c)  

Use the equation you found along with its interpretation as embodied in the first kinematic equation to determine the horizontal acceleration, a, of the cage as it slows down.What is its initial horizontal velocity, v1, at time t = 0 s? What is the initial position, x1, of the cage?

(d)  

The movie ends before the cage comes to a complete stop. Use your knowledge of a, v1, and x1 along with kinematic equations to determine the horizontal position of the cage when it comes to a complete stop so that the final velocity of the cage is given by v2 = v = 0.00 m/s.

Text Video

70.   Three Digital Movies Three digital movies depicting the motions of four single objects have been selected for you to examine using a video-analysis program.They are as follows:

Text Video

A cart moves on an upper track while another moves on a track just below.

Text Video

A metal ball attached to a string swings gently.

Text Video

A boat with people moves in a water trough at Hershey Amusement Park.

Please examine the horizontal motion of each object carefully by viewing the digital movies. In other words, just examine the motion in the x direction (and ignore any slight motions in the y direction). You may use VideoPoint, VideoGraph, or World-in-Motion digital analysis software and a spreadsheet to analyze the motion in more detail if needed. Based on what you have learned so far, there is more than one analysis method that can be used to answer the questions that follow. Note: Since we are interested only in the nature of these motions (not exact values) you do not need to scale any of the movies.Working in pixel units is fine.

(a)  

Which of these four objects (upper cart, lower cart, metal ball, or boat), if any, move at a constant horizontal velocity? Cite the evidence for your conclusions.

(b)  

Which of these four objects, if any, move at a constant horizontal acceleration? Cite the evidence for your conclusions.

(c)  

Which of these four objects, if any, move at neither a constant horizontal velocity nor acceleration? Cite the evidence for your conclusions.

(d)  

The kinematic equations are very useful for describing motions. Which of the four motions, if any, cannot be described using the kinematic equations? Explain the reasons for your answer.

71.   Speeding Up or Slowing Down Figure 2-42 shows the velocity vs. time graph for an object constrained to move in one dimension. The positive direction is to the right.
Figure 2-42 Problems 2-71, 2-72, 2-73, 2-74.

(a)  

At what times, or during what time periods, is the object speeding up?

(b)  

At what times, or during what time periods, is the object slowing down?

(c)  

At what times, or during what time periods, does the object have a constant velocity?

(d)  

At what times, or during what time periods, is the object at rest?

If there is no time or time period for which a given condition exists, state that explicitly.

72.   Right or Left Figure 2-42 shows the velocity vs. time graph for an object constrained to move along a line. The positive direction is to the right.

(a)  

At what times, or during what time periods, is the object speeding up and moving to the right?

(b)  

At what times, or during what time periods, is the object slowing down and moving to the right?

(c)  

At what times, or during what time periods, does the object have a constant velocity to the right?

(d)  

At what times, or during what time periods, is the object speeding up and moving to the left?

(e)  

At what times, or during what time periods, is the object slowing down and moving to the left?

(f)  

At what times, or during what time periods, does the object have a constant velocity to the left?

If there is no time or time period for which a given condition exists, state that explicitly.

73.   Constant Acceleration Figure 2-42 shows the velocity vs. time graph for an object constrained to move along a line. The positive direction is to the right.

(a)  

At what times, or during what time periods, is the object's acceleration zero?

(b)  

At what times, or during what time periods, is the object's acceleration constant?

(c)  

At what times, or during what time periods, is the object's acceleration changing?

If there is no time or time period for which a given condition exists, state that explicitly.

74.   Acceleration to the Right or Left Figure 2-42 shows the velocity vs. time graph for an object constrained to move along a line. The positive direction is to the right.

(a)  

At what times, or during what time periods, is the object's acceleration increasing and directed to the right?

(b)  

At what times, or during what time periods, is the object's acceleration decreasing and directed to the right?

(c)  

At what times, or during what time periods, does the object have a constant acceleration to the right?

(d)  

At what times, or during what time periods, is the object's acceleration increasing and directed to the left?

(e)  

At what times, or during what time periods, is the object's acceleration decreasing and directed to the left?

(f)  

At what times, or during what time periods, does the object have a constant acceleration to the left?

If there is no time or time period for which a given condition exists, state that explicitly.


Copyright © 2000-2003 by John Wiley & Sons, Inc. or related companies. All rights reserved.