|
|
|
|
|
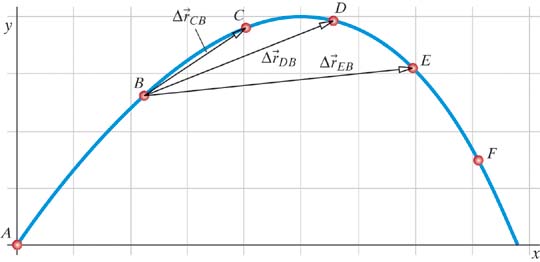
| Figure 1.33 |
The trajectory of a ball through air. The axes represent the x and y distance from the ball's initial location; each square on the grid corresponds to 10 meters. Three different displacements,
corresponding to three different time intervals, are indicated by arrows on the diagram.
|
|
|
|
|