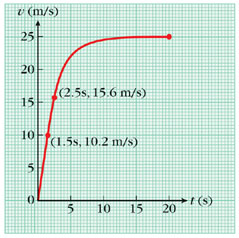
The motion of a certain object is represented by the v versus t graph in Figure 2-14. Find approximate values of the instantaneous acceleration
|
a. |
at t = 2.0 s |
|
b. |
at t = 20.0 s |
|
|||
| Figure 2-14 Graph of v versus t for Example 2-5. |
Solution
Choice of approach. Pick a small segment of the graph that includes each instant, then find the slope of each segment.
The mathematical solution.
|
a. |
To include t = 2.0 s, we arbitrarily pick the interval from t1 = 1.5 s to t2 = 2.5 s. (You can redo this choosing an even smaller interval to see how much it changes your result—see Problem 2-100 at the end of the chapter.) From the graph, we find that the velocity at t1 = 1.5 s has the value v1 = 10.2 m/s, and at t2 = 2.5 s, its value is v2 = 15.6 m/s. The slope of the chosen segment is
|
|
|
b. |
As we go beyond t = 10 s, we see the graph becoming more nearly horizontal. Because the slope of any horizontal line is zero, the slope of
a small enough segment including t = 20.0 s is approximately zero, and so a ≈ 0. |
|

Making sense of the results. The value obtained in b reflects the fact that by t = 20 s, the velocity is no longer changing.