 |
|
|||
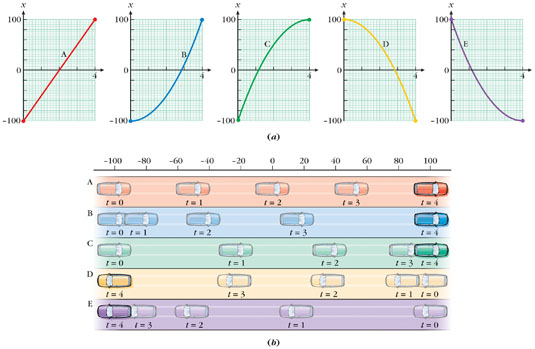
| Figure 2-8 (a) Graphs of position versus clock reading for cars with constant (A) and nonconstant (B–E) velocities. See WebLink 2-4 for more detail. (b) Picturing the motions described by these graphs. The centers of the cars are at the graphed positions. |
|
Copyright © 2004 by John Wiley & Sons, Inc. or related companies. All rights reserved. |