 |
|
|||
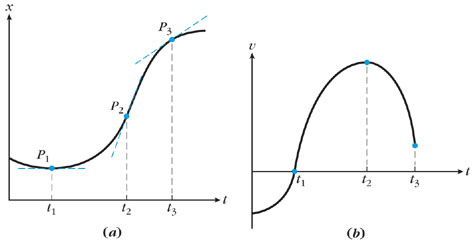
| Figure 2-9 Graphs of x versus t and v versus t for the same nonuniform motion. (a) In the x versus t plot, the slopes of the tangents give the velocities. (b) In the v versus t plot, those slopes are plotted against t. Note that the horizontal tangent at t1 has zero slope. |
|
Copyright © 2004 by John Wiley & Sons, Inc. or related companies. All rights reserved. |