|
a. |
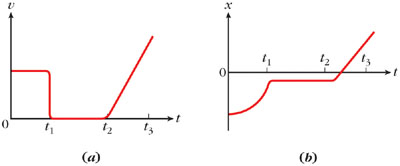
Graph a in Figure 2-36a shows an object's velocity plotted against t. Sketch a graph of its position x plotted against t. |
|
b. |
Repeat a, but this time assume the object is to the right of the origin at t = 0. (Did you make any assumption about where the object was at t = 0 when you answered part a the first time?) |
|
c. |
Graph b in Figure 2-36b shows an object's position plotted against t. Sketch a graph of its velocity against t. |