| 2-4 |
|
Acceleration and Graphs of Accelerated Motion |
We have looked at several situations in which an object's velocity changes over time. We know that an object, in everyday language, can pick up or lose speed. A powerful sports car picks up speed more quickly than an economy car; a braking car loses speed more quickly on dry pavement than on an icy road. It is therefore useful to talk about the rate at which it happens. But we want to do so in language consistent with describing motion in terms of position, displacement, and velocity. We therefore will define acceleration as the rate at which velocity changes with time. If an object's velocity is v1 at instant t1 and v2 at instant t2, then we define average acceleration as follows:
|
Definition: Over the interval Δt = t2 − t1,
|
||||
| Procedure 2-2 | ||||||||||||||||||
| Determining Average Acceleration in One Dimension | ||||||||||||||||||
|
|
||||||||||||||||||
Let's see how this definition works in the case of the cart in Figure 2-13a. The cart leaves the hand in the downhill direction at t = 0 , but soon reverses direction because of the suspended weight. Look at its v versus t graph (Figure 2-12a). At t1 its velocity is negative; it is moving to the left. At t2 its velocity is zero. Thus, over the interval Δt = t2 − t1,
 |
 |
By similar arguments, we can conclude that the average acceleration of the cart in Figure 2-13b (which goes right immediately after leaving the hand at t = 0, but later goes left) is negative throughout. We can now summarize our reasoning:
|
||||||||||||||||||||||||||||||||||||||||||||||||||||||||||||||||||||||||||||||||||||||||||||||||||||||||||||||||||||||||||||||||||||||||||||||||||||||||||||||||||||||||||||||||||||||||||||||||||||||||||||||||||||||||||||||||||||||||||||||
![]() Units of Average Acceleration Average acceleration is the rate of change of velocity. For instance, if a car went from 0 to 60 mi/hr in 5 seconds, it would be gaining an average of 12 mi/hr each
second, or per second. Its acceleration in mixed units would be 12 (mi/hr)/s In SI, the units of average acceleration are
m/s (meters per second) divided by s, giving us (m/s)/s (meters per second per second). If, for example, your velocity changes
from 15 m/s to 35 m/s as your stopwatch advances from 3 s to 7 s, your velocity increases on the average by 5 m/s during each
second of the 4-s time interval. Then
Units of Average Acceleration Average acceleration is the rate of change of velocity. For instance, if a car went from 0 to 60 mi/hr in 5 seconds, it would be gaining an average of 12 mi/hr each
second, or per second. Its acceleration in mixed units would be 12 (mi/hr)/s In SI, the units of average acceleration are
m/s (meters per second) divided by s, giving us (m/s)/s (meters per second per second). If, for example, your velocity changes
from 15 m/s to 35 m/s as your stopwatch advances from 3 s to 7 s, your velocity increases on the average by 5 m/s during each
second of the 4-s time interval. Then
 |
![]() Average Acceleration as Slope of v Versus t Graph If we apply the general definition of slope
Average Acceleration as Slope of v Versus t Graph If we apply the general definition of slope
 . But is our definition of average acceleration.
|
The slope of a v versus t graph between t1 and t2 is equal to the average acceleration over that interval. |
||
The graph in Figure 2-12a rises left to right—its slope is always positive. The descending graph in Figure 2-12b always has a negative slope. But the slope is the average acceleration. So as we concluded previously, the acceleration is always positive for the motion graphed in Figure 2-12a and always negative for the motion graphed in Figure 2-12b.
Definition: In one dimension,
![]() Instantaneous Acceleration Like average velocity, average acceleration is defined over an interval. As we did for average velocity in WebLink 2-1, we can find average accelerations for progressively smaller time intervals. The value approached as the interval closes
in on a particular instant is defined to be the acceleration at that instant.
Instantaneous Acceleration Like average velocity, average acceleration is defined over an interval. As we did for average velocity in WebLink 2-1, we can find average accelerations for progressively smaller time intervals. The value approached as the interval closes
in on a particular instant is defined to be the acceleration at that instant.
![]()
Without a bar, a denotes instantaneous acceleration.

![]()
![]()
When the v versus t graph is not a straight line, we can “zoom in” on a segment that includes any instant t that interests us. If we zoom in close enough, the segment is essentially straight, and its slope gives the instantaneous acceleration at that instant.
|
|
Determining Instantaneous Accelerations by Finding Slopes | |||||||||||||||||||||||||||
|
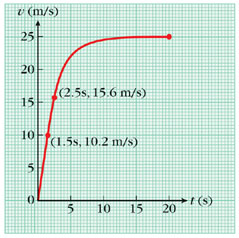
The motion of a certain object is represented by the v versus t graph in Figure 2-14. Find approximate values of the instantaneous acceleration
Solution Choice of approach. Pick a small segment of the graph that includes each instant, then find the slope of each segment. The mathematical solution.
Making sense of the results. The value obtained in b reflects the fact that by t = 20 s, the velocity is no longer changing.
|
||||||||||||||||||||||||||||
|
Copyright © 2004 by John Wiley & Sons, Inc. or related companies. All rights reserved. |