Thus far, we have assumed that the limiting reactant is always consumed completely in a reaction, but this is not always the case because many reactions reach equilibrium with substantial amounts of reactant still present. Recall that a reaction at equilibrium is a dynamic process in which the reaction continues but with no net change in the amount of product because the product is consumed at the same rate at which it is formed. To emphasize the dynamic nature of the process, equilibria are represented with double arrows. A ⇌ B implies that, not only is A producing B, but B is also producing A. The preceding discussion is a review of the kinetic definition of equilibrium, but this chapter focuses on its thermodynamic basis, ΔG = 0. Indeed, we will show how equilibrium constants can be determined from thermodynamic data.
4.1 Entropy
Introduction
In CAMS Section 9.6, we described entropy as a measure of the number of ways over which the energy of a system could be dispersed. We now explain the basis for the previous treatment.
Prerequisites
•
CAMS 9.6 Second Law of Thermodynamics
Objectives
•
Explain entropy.
•
Name the different degrees of freedom.
•
Relate entropy to the extent of the restrictions on the motion of the particles.
•
Define "Density of States" and explain how it is related to entropy.
•
Explain how the relative disorder of two systems can be used to determine relative entropies.
•
Explain why systems with higher entropies are favored over those with lower entropies.
•
Distinguish between translations, rotations, and vibrations.
•
Describe the degrees of freedom of a diatomic molecule.
•
Explain how the energy of a molecule is stored in its degrees of freedom.
•
Explain how the energy of a system depends upon the energy of its molecules.
•
Explain how the relative order of a system can be used to predict its relative entropy.
•
Relate the sign of ΔS for a process to the change in the number of moles of gas it causes.
•
Determine whether the entropy of reaction is positive, negative, or very small.
•
Indicate the effects on the entropy of a system caused by adding heat and how the effect is dependent upon the temperature at which the heat is added.
4.1-1. Degrees of Freedom
The energy of a molecule is distributed in the relative motions of its atoms, which are called the degrees of freedom of the molecule. The motion of each atom can be described as a combination of three directions (x, y, and z), so each atom has three degrees of freedom, and a molecule with N atoms has 3N degrees of freedom. The degrees of freedom are:
•
Translational degrees of freedom involve straight line motion of the center of mass. Translations in molecules result when all of the atoms move in the same direction.
•
Rotational degrees of freedom involve rotations of the molecule about an axis through the center of mass of the molecule.
•
Vibrational degrees of freedom are derived from the relative motion of the atoms within the molecule. Vibrations involve small changes in the bond lengths and angles, which oscillate about the equilibrium geometry.
Figure 4.1 shows the six degrees of freedom of a diatomic molecule. The motions can be broken down into three translations, two rotations, and one vibration. Click on each image to start or stop an animation of that degree of freedom.
Figure 4.1: Degrees of Freedom of a Diatomic Molecule (a) Atoms moving in the same direction produce three translations. (b) Atoms moving in opposite directions perpendicular to the bond produce two rotations. (c) Atoms moving in opposite directions along the bond result in one vibration.
4.1-2. The Energy of a Molecule versus the Energy of a System of Molecules
The energy of a molecule is the sum of its translational, rotational, and vibrational energies.
The energy of a degree of freedom is quantized just as the energy of an electron in an atom or molecule is quantized. Thus, there are translational, rotational, and vibrational quantum numbers and energy levels. The speed with which a molecule translates, the frequency with which it rotates, and the speed with which its atoms move relative to one another as it vibrates are all dictated by its translational, rotational, and vibrational quantum numbers. The energy of the mth molecule in a system composed of many molecules can be expressed as a sum of the energies of each of its degrees of freedom as follows:
( 4.1 )
Em = Etrans + Erot + Evib
Partitioning the Energy of a Molecule into its Degrees of Freedom
The energy of a system of molecules is the sum of the energies of all of the molecules in the system.
( 4.2 )
Etotal =
Em
m
System Energy is the Sum of Molecular Energies
where Em is the energy of the mth molecule as defined in Equation 4.1
, and the sum is over all of the molecules (m) in the system.We will discuss molecular energies in this section, which are very small. We therefore use a generic 'U' to indicate an arbitrary unit of energy, so read 6 U as six units of energy. For example, if a molecule has 4 U of translational energy, 2 U of rotational energy, and 0 U of vibrational energy, then Equation 4.1
allows us to determine that its total energy is Em = 4 + 2 + 0 = 6 U. If a system contains three molecules with 6, 3, and 3 U of energy each, then Equation 4.2
can be used to determine that the total energy of the system is Etotal = 6 + 3 + 3 = 12 U.
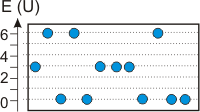
4.1-3. Representing Molecular Energies
Molecules have allowed energies, just as electrons in atoms, and we can draw energy level diagrams for them just as we did for electrons in atoms. Consider particle X that has energy levels at 0, 3, 6, 9, ... U shown in Figure 4.2. The allowed energy levels of X particles in the energy range of the figure are shown as dotted lines, while the energy of a particular particle, which is 3 U for the particle in the figure, is shown by the blue circle lying on the line at 3 U.
Figure 4.2: Allowed Energy Levels of X
4.1-4. Energy Configurations
If the temperature of a collection of three X particles is such that Etotal = 6 U, and the allowed energy levels of each X particle are only at 0, 3, 6, 9, and 12 U, then there are only two combinations, called energy configurations, that produce 6 U:
1
Etotal = 6 + 0 + 0
2
Etotal = 3 + 3 + 0
So either one X particle has 6 U and the other two have none, or two particles have 3 U each and the third has none. The energy configuration that the system is actually in at any given time will vary as the molecules collide. For example, a particle with 6 U might collide with one that has no energy to produce two particles with 3 U of energy each. However, as long as the temperature (total energy) remains the same, the molecules would always be in one of these two configurations. Recall that thermal energy is the average kinetic energy of the molecules; some have more energy and others have less.The energy of an electron configuration is the energy of the system and can be written as given in Equation 4.2
, but we can also sum over the energy levels rather than the individual molecules as given in Equation 4.3, below.
( 4.3 )
Etotal =
niEi
i
System Energy in terms of Energy Levels and their Population
i is the number of the energy level, Ei is the energy of the level, and ni is the number of particles in that level. Thus, instead of writing E = 6 + 0 + 0, we could write E = 6 + 2(0) to indicate that one particle has 6 U of energy and two particles have no energy. Similarly, E = 3 + 3 + 0 could be written E = 2(3) + 0.
4.1-5. The Weight of a Configuration
The number of ways in which a configuration can be achieved is called the configuration weight of the configuration and given the symbol W. The weight of a configuration can be determined with Equation 4.4.
( 4.4 )
W =
N!
Πni!i
Weight of an Energy Configuration
N is the number of particles in the system, ni is the number of particles that are in the Ei energy level. ! = factorial. 4! = 4 · 3 · 2 · 1 = 24. By definition, 0! = 1.For example, consider a system with 14 particles. One particle has 0 U of energy, five particles have 2 U, two particles have 4 U, three particles have 6 U, and three particles have 8 U. Using Equation 4.3
, we determine the total energy as follows: Etotal = 1(0) + 5(2) + 2(4) + 3(6) + 3(8) = 60 U, where the numbers in parentheses are the Ei and their multipliers are the ni. Using the ni and N = 14, we determine the weight of this configuration to be
There are over one million ways in which this configuration can be achieved! They differ only in which particle has no energy, which five particles have 2 U, which two particles have 4 U, etc.
4.1-6. Determining Weight Exercise
Exercise 4.1:
What is the total energy of the system shown in the figure, and what is the weight of the configuration?
Etotal =30_0__3(6 U) + 4(3 U) + 5(0 U) = 30 UU
N =12_0__3 + 4 + 5 = 12 particlesparticles
W =27720_0__Use Equation 4.4 with
N = 12
, and ni's of 3, 4, and 5.
W =
12!
3!4!5!
= 27,720
ways to achieve energy with this configuration
4.1-7. Distributing Energy into Three X particles
We now examine the different ways in which three X particles can be distributed in a system with a total energy of 6 U. Recall that the individual X particles have energy levels only at 0, 3, and 6 U. As shown in Figure 4.3, there are only two configurations that yield a total energy of 6 U: 1(6) + 2(0) and 2(3) + 1(0), which are represented by the a and b figures. There are three particles, so there are clearly three different ways in which one particle can have 6 U of energy, so the weight of the configuration in Figure a is Wa = 3. Similarly, there are three different ways in which one particle can have zero energy, so Wb = 3 for the distribution of Figure b. However, we can arrive at these weights using Equation 4.4
Thus, there are just six allowed energy states for this system. The six ways to distribute the energy in these two configurations are shown graphically in the figure.
Figure 4.3: Six ways of Distributing 6 U of Energy into for Three X Particles
shows that the W increases when the number of particles (N) increases or the number of particles in each energy level (each ni) decreases. The number of particles in any one level decreases as the number of available levels increases. We now demonstrate this affect by again considering a system of three particles with a total energy of 6 U. However, this time the system is composed of Y molecules with energy levels that are separated by only one energy unit. The energy levels available to each Y molecule in a system with a total energy of 6 U are 0, 1, 2, 3, 4, 5, or 6 U. The fact that each Y molecule has more levels available to it in this energy range than does each X molecule means that there are more ways to distribute the energy in the Y molecules. Indeed, Figure 4.4 shows that there are seven possible energy configurations. The weight of each configuration is determined in the figure. Summing the weights of the seven configuration, we obtain 3 + 6 + 6 + 3 + 6 + 3 + 1 = 28 different ways for Y particles to distribute 6 U of energy, while there were only six states of X molecules with 6 U of energy. The number of states available in this energy range is greater for Y molecules, so we say that Y has a greater density of states. The density of states is greater for Y molecules because the energy separation between allowed levels in individual Y molecules is smaller; i.e., there are more energy levels available.
Figure 4.4: Seven Configurations of Y Particles that Produce 6 U of Energy
4.1-9. Increasing Energy and the Number of Ways to Distribute Energy
Exercise 4.2:
In how many ways can a system of three X particles (energy levels at 0, 3, 6, 9, ... U) distribute 9 U of energy?
The number of possible configurations with 9 U of energy:3_0__The following configurations result in 9 U. 9 + 0 + 0, 6 + 3+ 0, and 3 + 3 + 3.
The weight of the configuration in which one particle has 9 U:3_0__E = 1(9) + 0(6) + 0(3) + 2(0), so W = 3!/1!0!0!2!
The weight of the configuration in which one particle has 6 U:6_0__E = 0(9) + 1(6) + 1(3) + 1(0), so W = 3!/0!1!1!1!
The weight of the configuration in which no particle has either 6 U or 9 U:1_0__E = 0(9) + 0(6) + 3(3) + 0(0), so W = 3!/0!0!3!0!
The number of ways in which three X particles can distribute 9 U of energy:10_0__The total number of ways is the sum of the weights of the allowed configurations.
4.1-10. Distributions and Temperature
We have seen that there are only six ways for three X particles to distribute 6 U of energy, but, as shown in the figure below, there are ten ways in which they can distriubute 9 U. Thus, increasing the energy of a system increases the number of ways in which it can distribute the energy. Since the energy of a system is dictated by its temperature, we conclude that
Increasing the temperature of a system always increases the number of ways in which it can distribute its energy.
Figure 4.5: Distributions of 10 U of Energy by Three X Particles
4.1-11. Entropy Defined
Now consider the process in which 3 X molecules are converted into 3 Y molecules: 3 X → 3 Y.We assume that ΔH ~ 0, so the enthalpy change is not a factor in the reaction. If the temperature is such that the energy of the reaction mixture is 6 U, then there are 28 states over which three Y molecules can distribute the energy but only 6 states over which three X molecules can distribute it, which is represented in Figure 4.6. Consequently, energy is more likely to be found on Y molecules than on X molecules. For this purely statistical reason, the number of Y molecules at equilibrium will be greater than the number of X molecules, i.e., the reaction is extensive. The number of ways in which a system can distribute energy is an important property of the system, and a thermodynamic property of the system, called entropy (S), is used to measure it. The entropy (S) of a system is related to the number of ways in which it can distribute its energy (W) by the Boltzmann formula given in Equation 4.5.
( 4.5 )
S = k ln W
Boltzmann Formula for Entropy
k is the Boltzmann constant, which equals the ideal gas constant divided by Avogadro's number: k = R/Na = 8.314/6.023 × 1023 = 1.381 × 10⁻²³ J·K–1.
Figure 4.6: Energy States Available for 3X and 3Y
Each box represents an allowed energy state. 3Y has over four times as many states as 3X, so energy is over four times as likely to be found on 3Y as on 3X, so 3X → 3Y is extensive if ΔH ~ 0.
4.1-12. Two Driving Forces
Systems with high entropies are favored over those with low entropies because systems with high entropies can distribute energy over more states. The entropy of Y(SY) is greater than the entropy of X (SX) because Y can store energy in more ways than X. The entropy change for the process X → Y is ΔS = SY – SX, so ΔS > 0 for the process, and the process is extensive so long as ΔH ~ 0 because the product can disperse energy better than the reactant. Thus, systems strive to maximize the number of ways they can distribute their energy, but they also strive to minimize their potential energy. We conclude that the two driving forces behind a process are:
1
the tendency of systems to minimize their potential energy (ΔH )
2
the tendency of systems to maximize the dispersion of their energy (ΔS)
These two forces can operate in concert or in opposition.
4.1-13. Entropy and Constraints
The entropy of a less constrained system is greater than the entropy of a more constrained system.
The spacing between the energy levels of a degree of freedom depends upon the extent to which the particles are constrained (confined or restricted) during the motion. As shown in Figure 4.7, the more restricted the motion of a particle is, the more restricted the number of energy levels that are available to it is. If there are no constraints on the motion of a particle (a free particle), then there are no constraints on the energies it can have. However, as soon as a particle is constrained to a small region, its movement becomes quantized and the number of available energies decreases. As the particle's motion becomes more restricted, the available energies also become more restricted. In other words, the density of states of a motion increases as its constraints are reduced. The entropy of a system depends upon the density of states of the system, so less constrained systems have higher entropies than do more constrained systems.This behavior is illustrated nicely by an electron. The gap between levels in a molecule in which the bonding electrons are localized into one bond is very large, but when the electrons are delocalized over a number of orbitals, the gap decreases. In the case of a metal, where the electrons are spread out into orbitals involving millions of atoms the energy gap between levels goes almost to zero as an energy band is formed. In the limit of a free electron, one that is not constrained to the region around an atom or a bond, there are no energy levels, so any energy is available to the electron.
Figure 4.7: Density of States is Greater for Less Constrained Systems.
(a) A free particle can have any energy. (b) The energy of a constrained particle is quantized. (c) The separation between energy levels increases (density of states decreases) as the constraints on the motion are increased.
4.1-14. Entropy and States of Matter
The entropy of a gas is much greater than that of a liquid or a solid.
We now compare the entropies of a substance in the gas and solid states. The differences in entropy between the two states of matter result from differences in the restrictions on the degrees of freedom. However, the major constraints on vibrational motion are due to the bonds, which are similar in the solid and gas phase, so vibrations are very similar in the solid and the gas and have little impact on entropy differences between the two states. Thus, it is differences in the translational and rotational degrees of freedom that result in large differences in entropies for the two states. Click on each image in Figure 4.8 to compare a translation and rotation in the solid and gas phases.
Translation in a gas
Molecules in the gas are confined to the relatively large volume of a flask, so the motion is not very constrained. Consequently, the density of states for translational motion is very high in the gas phase.
Translation in a solid
Translational motion in a solid is constrained to an oscillation about the molecule's equilibrium position in the lattice. Increasing the restriction on the motion decreases the density of translational states, i.e., the translational energy levels are much farther apart in the solid than in the gas.
Rotation in a gas
Rotational levels in the gas are relatively close together because the rotation is not constrained.
Rotation in a solid
Rotational energy levels are much farther apart in the solid because other molecules in the solid constrain the rotation to a back-and-forth oscillation about the equilibrium position.
Table 4.1
Translational and rotational motion in the liquid state are also very constrained, but they not quite as restricted as in the solid. We conclude that translational and rotational motion is much more restricted in the liquid and solid states, so the density of states is much greater in the gas. Consequently, the relative entropies of a substance in the three states of matter follow the following trend:
•
Sgas >> Sliquid > Ssolid
Figure 4.8: Motion is Free in the Gas but Constrained in the Solid
4.1-15. Disorder as a Guide to Entropy
Disorder is often used as an indicator of entropy. A more disordered system almost always has a higher entropy than a more ordered one.
We have now shown that the entropy of a system decreases as the constraints on the particles in the system are increased. However, increasing the constraints on a system ordinarily introduces order into the system. For example, constraining gas phase molecules sufficiently moves them from a very disordered collection of molecules undergoing random motion into a very ordered collection of molecules in the solid state that undergo organized motion. Indeed, entropy is often defined as a measure of the amount of disorder in a system—highly disordered systems have high entropies. Although, entropy is actually a measure of the number of energy states available to the system, disorder is a good indicator because disordered systems like the gas phase have higher densities of states than do ordered ones. Therefore, we will occasionally use the relative disorder in two systems as an indicator of their relative entropies.
4.1-16. Entropy and the Change in the Number of Moles of Gas
Processes that increase the number of moles of gas have large, positive entropy changes.
Sgas >> Sliquid > Ssolid, so entropy changes for processes that increase the number of molecules in the gas phase increase the entropy of the system, while processes that decrease the number of molecules in the gas phase decrease the entropy of the system. Entropy changes in processes that do not change the number of moles of gas are usually much smaller than those that do. In these cases, enthalpy changes dominate.
Entropy changes drive vaporization.
The entropy of vaporization (ΔSvap = Sgas – Sliquid) is always large and positive because vaporization increases the number of moles of gas, which is the driving force behind the vaporization of a liquid even though vaporization is endothermic.
4.1-17. Example
The entropy change of a reaction is proportional to the change in the number of moles of gas caused by the reaction.
Although entropy is an important factor in some processes, such as evaporation, it is more often the case that lowering the enthalpy of the system is far more important. Consequently, we need to be able to determine whether the entropy change of a process is large and negative (ΔS < 0), large and positive (ΔS > 0), or small enough to be neglected (ΔS ~ 0). Use the following facts to predict the sign of ΔS for a reaction.
•
ΔS > 0 for reactions that produce gas.
•
ΔS < 0 for reactions that consume gas.
•
ΔS ~ 0 (is usually negligibly small) for reactions that do not involve gas phase molecules.
Exercise 4.3:
Predict the sign of ΔS° for each of the following reactions:
CaCO3(s) → CaO(s) + CO2(g)
ΔS < 0
ΔS > 0The reaction produces gas, so ΔS° > 0. The actual value is 159 J/K.
ΔS ~ 0
3H2(g) + N2(g) → 2NH3(g)
ΔS < 0The balanced equation shows four moles of gas on the right and only two on the left. Consequently, gas is consumed, so ΔS° < 0. The actual value is –199 J/K.
ΔS > 0
ΔS ~ 0
Ag(s) + NaCl(s) → AgCl(s) + Na(s)
ΔS < 0
ΔS > 0
ΔS ~ 0There are no gases involved in the reaction, so the entropy change is expected to be small, i.e., ΔS° ~ 0. The actual value is 33 J/K.
H2O(l) → H2O(g)
ΔS < 0
ΔS > 0The reaction produces gas, so ΔS° > 0. The actual value is 118 J/K.
ΔS ~ 0
H2O(l) at 25 °C → H2O(l) at 5 °C
ΔS < 0The entropy of a system always decreases when its temperature is lowered. Consequently, ΔS° < 0, but it is small because the temperature change is small. The actual value is –13 J/K.
ΔS > 0
ΔS ~ 0
4.1-18. Effects of Heat and Temperature on Entropy
The entropy of a system increases as the total energy increases. For example, recall that, when the energy of the system of X molecules was raised from 6 to 9 units, the number of possible ways to distribute the energy increased from 6 to 10, and dispersing the energy in 10 ways rather than 6 means an increase in the entropy of the system. The energy of a system depends upon its temperature, so the entropy of a system always increases with temperature. One way to increase the energy of a system is to add heat. However, the addition of a fixed amount of heat to a system has a much larger impact on the system when the system entropy is low because increasing the number of accessible states has more impact when there are only a few states to start with. The system entropy is low when its temperature is low, so we can say that the effect of heating is reduced as the temperature at which it is heated is raised. Using disorder as an indicator of entropy, we can better understand this relationship by considering the effect on the change in order of a room that results when a book is casually dropped in it. The probability is very high that the book will NOT drop into its allotted location on the bookshelf, so the dropped book will increase the disorder (entropy) of the system. In a neat room (representing a more ordered, lower temperature system), the effect of the out-of-place book is dramatic. However, its effect on a messy room (representing a higher temperature, less ordered system) is negligible as the out-of-place book is hardly noticeable. Similarly, adding 1 J of heat to a solid at 5 K (very ordered, low entropy) has a much more dramatic effect on the entropy than adding 1 J to the vapor at 500 K (disordered, high entropy).The relationship between the change in entropy caused by the addition of heat at some temperature is given in Equation 4.6.
( 4.6 )
ΔS =
heat added reversibly
temperature at which the heat is added
=
qrev
T
J/K
qrev is used to indicate that the heat must be added reversibly, which means that it must be added so slowly that the slightest change could reverse the direction of heat flow. Note that the units of entropy from the above are J·K–1, and that TΔS has units of J, so it is an energy term.
4.1-19. Entropy Exercise
Exercise 4.4:
Indicate which process in each of the following pairs increases the entropy of the system more:
adding 10 J of heat to neon at 300 K
adding 50 J of heat to neon at 300 K Use ΔS = q/T. The heat is added at the same temperature, so the greater entropy change occurs when the greater amount of heat is added. Consequently, adding 50 J results in a greater entropy change than adding 10 J at 300 K.
adding 10 J of heat to neon at 300 KUse ΔS = q/T. The amount of heat added is the same, so the greater entropy change occurs when the heat is added at the lower temperature. Consequently, adding 10 J results in a greater entropy change at 300 K.
adding 10 J of heat to neon at 800 K
adding 50 J of heat to neon at 800 KUse ΔS = q/T. (50/800) > (10/300), so adding 50 J at 800 K causes a larger entropy change.
adding 10 J of heat to neon at 300 K
melting 1 g of neon at its melting point
evaporating 1 g of neon at its boiling point Use ΔS = Sfinal – Sinitial.
melting: ΔS = Sliquid - Ssolid
evaporating: ΔS = Sgas - Sliquid
Previously we concluded that Ssolid < Sliquid << Sgas, so (Sgas – Sliquid) > (Sliquid – Ssolid). Entropy of evaporation is greater than entropy of melting. As a very good rule, entropy increases for processes that create gases and decreases for processes that consume gases.
4.2 The Second and Third Laws of Thermodynamics
Introduction
Our discussions of entropy have been restricted to changes in the system, but processes impact the entropy of both the system and its surroundings. In this section, we extend our studies to changes in the universe.
Prerequisites
•
CAMS 9.6 Second Law of Thermodynamics
Objectives
•
Predict whether a reaction is spontaneous from ΔG.
•
Determine ΔG from the values of ΔH and ΔS.
•
State the second law of thermodynamics.
4.2-1. The Second Law of Thermodynamics
Recall that a spontaneous process is one that occurs without intervention, so you may be asking "If the dispersal of energy is so important, why isn't entropy alone sufficient to predict spontaneity?" The short answer is: systems interact with their surroundings, so it is the entropy of the universe not just the system that dictates spontaneity. This important difference is stated in the second law of thermodynamics.
•
Second Law of Thermodynamics: the entropy of the universe increases (ΔSuniv > 0) for all spontaneous processes
In other words, a spontaneous process is one that increases the number of states over which the energy of the universe is dispersed.
4.2-2. Heat Flows from Hot to Cold
The fact that heat flows from a hot source to a cold one is a consequence of the second law. For example, consider the heat flow between two systems at different temperatures as shown in the figure. We assume that the two thermal reservoirs, which are at temperatures T1 and T2, are brought into contact in an insulated container (represented by the black border in the figure). The conditions under which heat flows spontaneously from T1 to T2 are determined by the second law as follows:
Figure 4.8
1
Determine ΔSuniv
According to the second law, heat flows spontaneously in the direction in which ΔSuniv > 0. The two reservoirs are insulated, so the two reservoirs constitute a thermodynamic universe (no heat can pass through the insulation). Consequently,
ΔSuniv = ΔS1 + ΔS2
> 0
2
Determine ΔS
q joules flow out of system 1 and into system 2, so
ΔS1 = –q/T1 and ΔS2 = +q/T2.
The sign of ΔS indicates the direction of the heat flow.
which is true only if T1 > T2. Consequently, heat flows spontaneously from a hot source to a cold one as a consequence of the second law of thermodynamics.
Table 4.2
4.2-3. The Third Law
Thermodynamic tables give values for ΔH°f rather than simply H because only relative enthalpies (ΔH's) can be determined. However, tabulated values of S° are known because there is a known reference point for entropy. This reference point is established by the third law of thermodynamics. To establish the third law, we define a perfect crystal as one in which all lattice sites are occupied by the correct particles, which differs from a real crystal in which some sites may not be occupied or may be occupied by impurities. We must also recognize that all molecules at 0 K are in their lowest energy levels. Thus, there is just one way in which the energy of a perfect crystal at 0 K can be distributed; i.e., W = 1 for a perfect crystal at 0 K. Applying Equation 4.5
, we obtain S = k ln(1) = 0. This conclusion is stated in the third law of thermodynamics.
•
Third Law of Thermodynamics: The entropy of a perfect crystal at 0 K is zero.
The third law gives us a reference point for entropy that we do not have for enthalpy or free energy. We can determine differences in enthalpy (ΔH) and free energy (ΔG) but not absolute values (H and G). We can determine the entropy difference between a substance at 0 K and at 298 K, ΔS = S298 – S0, and because we know that S0 = 0, we know the absolute value of the entropy at 298 K. Consequently, there is no Δ preceding the S in the heading of entropy tables. Note that the entropy of an element in its standard state at 298 K is not zero because every substance with nonzero thermal energy must have entropy.
4.2-4. Factors Influencing Absolute Entropies
The factors that influence the entropy of a substance are: its state of matter, its temperature, and the number and nature of its bonds.
•
The entropy of a substance increases in going from solid to liquid to gas (Ssolid < Sliquid << Sgas). For example, the absolute entropy of liquid water at 298 K is 69.91 J·mol–1·K–1while that of water vapor at 298 K is 188.7 J·mol–1·K–1.
•
The entropy of a substance always increases with temperature.
•
The entropy of a substance increases as the number of atoms it contains increases. This is because additional atoms provide more ways in which it can move (rotate and vibrate about the bonds), and the more ways it can move, the more disorder it has. For example, the entropy at 298 K of O atoms is 160.95 J·mol–1·K–1 while that of O2 molecules is 205.03 J·mol–1·K–1 and that of O3 molecules is 237.6 J·mol–1·K–1.
4.2-5. Predicting Relative Entropies Exercise
Exercise 4.5:
Indicate the substance with the greater entropy in each case.
CO(g) at 300 KBoth are gases at the same temperature, but CO2 has more degrees of freedom (atoms).
CO2(g) at 300 K
CO(g) at 250 KEntropy always increases with temperature.
CO(g) at 350 K
CO(g) at 300 K
I2(s) at 300 KThey have the same number of atoms and are at the same temperature, but CO is a gas, while I2 is a solid.
4.3 Determining Entropy Changes
Introduction
As with enthalpies, tabulated values of entropy are normally the standard state values and represented as S°. Everything we have discussed to this point applies to both standard or nonstandard conditions, and the superscript was unnecessary. However, tabulated thermodynamic properties are almost always standard state values, so the thermodynamic values we obtain from them are also for reactions at standard conditions. Consequently, we will use the superscript zero on our entropy changes, ΔS°, to indicate that the tabulated values of absolute entropies are all standard state values.
Objectives
•
Calculate the entropy change of a reaction from tabulated values of the absolute entropies of the reactants and the products.
4.3-1. Method
The entropy change accompanying a process is the entropy of the final state minus the entropy of the initial state: ΔS = Sf – Si. In a chemical reaction, the final entropy is the entropy of the products and the initial entropy is the entropy of the reactants. Consequently, the following expression can be used to determine ΔS° from tabulated values of standard state entropies:
( 4.7 )
ΔS° =
cP
×
S°P
−
cR
×
S°R
Standard Entropy Change from Absolute Entropies of Products and Reactants
•
cP is the coefficient in the balanced chemical equation of the product whose standard entropy is S°P.
•
cR is the coefficient in the balanced chemical equation of the reactant whose standard entropy is S°R.
If the standard entropies of all of the products and reactants are known, the standard entropy change of a reaction can be determined.
4.3-2. Example
Exercise 4.6:
Determine the entropy change for each process at 298 K and 1 atm.
H2O(l) → H2O(g)
First, look up the absolute entropy for each substance in the resource titled Thermodynamic Properties.
Substance
H2O(l)
→
H2O(l)
S°
69.91_0__The value listed in the resource titled "Selected Values of Standard Thermodynamic Properties at 298.15 K" is 69.91 J·mol–1·K–1.J·mol–1·K–1
188.7_0__The value listed in the resource titled "Selected Values of Standard Thermodynamic Properties at 298.15 K" is 188.7 J·mol–1·K–1.J·mol–1·K–1
Like enthalpy but unlike entropy, free energy is not absolute, so tables of G° do not exist. Consequently, free energies of formation are tabulated. The method used to determine the standard free energy of a reaction at 298 K is identical to that used to determine the standard enthalpy of a reaction from enthalpies of formation. However, the standard free energy can also be determined from enthalpies of formation and absolute entropies. We discuss both methods in this section.
Prerequisites
•
CAMS 9.7 Free Energy
Objectives
•
Determine free energy of a reaction from tabulated free energies of formation.
•
Define Gibbs free energy and explain why it is important.
•
Describe the two driving forces behind the free energy change and write the expression that shows how they are related to the free energy.
4.4-1. Free Energy
A spontaneous process at constant T and P is one in which ΔG < 0.
Entropy changes in the universe can be broken down into the changes in the system and its surroundings:
ΔSuniv = ΔS + ΔSsur
During the process, heat can be exchanged between the system and the surroundings, which changes the entropy of the surroundings. For a reaction carried out at constant T & P, the amount of heat that is transferred from the system to the surroundings is qsur = –ΔH, so ΔSsur = –ΔH/T. Thus, an exothermic reaction releases heat into the surroundings, which increases the entropy of the surroundings, while an endothermic reaction absorbs heat from the surroundings, which decreases the entropy of the universe. The entropy change in the universe resulting from a reaction carried out at constant temperature and pressure can then be expressed as follows:
ΔSuniv = ΔS − ΔH/T
Multiplying both sides by –T, we obtain –TΔSuniv = ΔH – TΔS. This system quantity is the Gibbs free energy change, ΔG.
( 4.8 )
ΔG = ΔH – TΔS = –TΔSuniv
Definition of Free Energy at constant T and P
The Second Law states that ΔSuniv > 0 for a spontaneous processes, so a reaction at constant temperature and pressure is spontaneous when ΔG < 0. Thus, the equation above shows driving forces behind a process carried out at constant T and P.
•
ΔG is the change in free energy. It dictates the spontaneous direction of the reaction. Reactions proceed spontaneously in the direction in which ΔG < 0.
•
ΔH is the change in potential energy that results from breaking and forming interactions. Reactions that lower their potential energy (ΔH < 0) reduce the free energy, which is favorable.
•
TΔS is the change in free energy caused by changing the number of ways energy can be dispersed in the system. Using order as our indicator for entropy, we would say that TΔS is the energy change associated with the change in order of the system. Thus, processes for which ΔS > 0 are favored because they lower the free energy of the system by introducing disorder.
As shown in Figure 4.9 (a), exothermic reactions release energy. They are spontaneous if the entropy change is small or positive. Any energy that is not used to overcome a negative entropy change is free energy. Endothermic reactions as shown in Figure 4.9 (b) cannot occur without an input of energy, so they can be spontaneous only if TΔS > ΔH.
Figure 4.9: Enthalpy
Processes for which ΔS > 0 in Figure 4.10 (a) release energy that can be used to drive reactions uphill in enthalpy, but any TΔS energy that is not used in this manner is released as free energy. Processes for which ΔS < 0 in Figure 4.10 (b) require energy, which must be supplied from ΔH if the process is to be spontaneous.
Figure 4.10: Entropy
4.4-2. Free Energy is Free to do Work
It is the free energy released in a reaction that is free to do work.
Not all energy released as ΔH can be harnessed to do work in reactions in which ΔS < 0, and not all of the energy contained in TΔS when ΔS > 0 can be used to do work if some must be used to overcome ΔH > 0. It is the net reduction in energy of the system that can be used to do work, which is the free energy of the reaction. Indeed, ΔG is referred to as the free energy because it is the energy that is free to do work; i.e., it the maximum amount of work that can be obtained from a reaction.
( 4.9 )
maximum work available from a reaction = –w = –ΔG
Free Energy and Work
The above equation states that the maximum work that can be done by the system equals the amount of free energy that is released by the system. The negative signs in Equation 4.9maximum work available from a reaction = –w = –ΔG are required because:
•
w is defined as the work done on the system, but we are interested in the work done by the system
•
ΔG is defined as the free energy that is absorbed, but free energy must be released to do work.
For example, if ΔG = –50 kJ then up to 50 kJ of work can be done by the process. Processes for which ΔG = 0 or ΔG > 0 are not spontaneous and cannot do work. However, such processes can sometimes be forced uphill in free energy by doing work on them. Thus, a process for which ΔG = +50 kJ can sometimes be accomplished by an input of over 50 kJ of work.
4.4-3. Standard Free Energy Equation
Most of our calculations will be for the standard state, so we apply Equation 4.8ΔG = ΔH – TΔS = –TΔSuniv to the standard state to obtain the standard free energy of reaction,
( 4.10 )
ΔG° = ΔH° − TΔS°
Standard Gibbs Free Energy
ΔG° is the free energy of a reaction when all reactants and products are in their standard state, so its sign indicates the spontaneous direction under this specific set of conditions. Consider the reaction A(g) → B(g). ΔG° is the value of ΔG when both A and B are in their standard states, which is a partial pressure of 1 atm for each gas. If ΔG° < 0, the spontaneous direction is A → B. If A is consumed and B is formed when they are at equal pressures, then B will be present in the greater amount when the reaction is complete; i.e., the reaction is extensive because there is more product than reactant at completion. If ΔG° > 0, the spontaneous process is A ← B when they are at equal pressures, so more A than B will be present at completion and the reaction is not extensive. We conclude that
•
The sign of ΔG° indicates the side of the reaction that is favored at equilibrium. If ΔG° > 0, the reactants are favored, but if ΔG° < 0, the products are favored.
4.5 Determining Free Energy Changes
Objectives
•
Determine standard state free energy changes for a reaction from either standard free energies of formation or standard enthalpies of formation and standard entropies.
4.5-1. Method
Values of standard free energies of formation (ΔG°f) can be found in the Resources titled Thermodynamic Properties. We again employ Hess's law of heat summation along with the free energies of formation to obtain free energies of reactions:
( 4.11 )
ΔG° =
cP(ΔG°f)P −
cR(ΔG°f)R
Free Energy of Reaction from Free Energies of Formation of Reactants and Products
•
(ΔG°f)P is the standard free energy of formation of the product whose coefficient in the balanced equation is cP
•
(ΔG°f)R is the standard free energy of formation of the reactant whose coefficient in the balanced equation is cR
The result obtained in this manner is the same as would be obtained by determining the ΔH° and ΔS° of the reaction and applying Equation 4.8ΔG = ΔH – TΔS = –TΔSuniv.As with enthalpies, the units of free energies of formation are kJ·mol–1, but multiplication by the number of moles of each substance in the balanced equation produces units of kJ for free energy changes in thermochemical equations.
4.5-2. Determining ΔG° Exercise
Exercise 4.7:
Determine the standard free energy of reaction at 298 K and 1 atm for each process from free energies of formation and from enthalpies of formation and absolute entropies.
H2O(l) → H2O(g)
H2O(l)
→
H2O(g)
ΔG°f
–237.2
–228.58
kJ/mol
ΔH°f
–285.83
–241.82
kJ/mol
S°
69.91
188.7
J/mol·K
ΔG° from ΔG°f
ΔG° =8.6_0__–228.59 – (–237.2)kJ
ΔG° from standard enthalpies and entropies
ΔH° =44.01_0__–241.82 – (–285.83)kJ
ΔS° =118.8_0__188.7 – 69.91J/mol·K
ΔG° =8.6_0__44.01 – (298)(0.1188) (The entropy change must be converted to kJ/mol·K in order for TΔS° to have the same units as ΔH°.)kJ
H2(g) + I2(g) → 2 HI(g)
H2(g)
+
I2(g)
→
2 HI(g)
ΔG°f
0
19.36
1.71
kJ/mol
ΔH°f
0
62.438
26.5
kJ/mol
S°
130.57
260.6
206.48
J/mol·K
ΔG° from ΔG°f
ΔG° =-15.94_0__2(1.71) – 19.36 – 0kJ
ΔG° from standard enthalpies and entropies
ΔH° =-9.4_0__2(26.5) – 0 – 62.438kJ
ΔS° =21.79_0__2(206.48) – 130.57 – 260.6J/mol·K
ΔG° =-15.9_0_3_–9.4 – 298(0.0218) (Entropy must be in kJ/mol·K to add to the enthalpy term.) kJ
ΔG° =-33.0_0_3_–92.22 – 298(–0.1986) (Entropy must be in kJ/mol·K to add to the enthalpy term.)kJ
4.5-3. Free Energy and the Balanced Equation
As with enthalpy, the entropy and free energy of reaction change signs when the direction of the reaction is reversed. If a chemical equation is multiplied by a number, then the values of ΔS and ΔG must also be multiplied by that number. For example, consider the thermochemical equations below.
Free Energy and Balanced Equations
Reaction
ΔH°
kJ/mol
ΔG°
kJ/mol
ΔS°
J/mol·K
A: N2(g) + 3H2(g) → 2NH3(g)
–92.2
–33.0
–198.6
B: 1/2 N2(g) + 3/2 H2(g) → NH3(g)
–46.1
–16.5
–99.3
C: 2 NH3(g) → N2(g) + 3 H2(g)
92.2
33.0
198.6
Table 4.3: Thermodynamic Properties as a Function of How the Reaction Is Written
Reaction A is the reaction considered in the previous example. In Reaction B, the reaction has been multiplied by 1/2 as have all of the thermodynamic properties. Reaction C is the reverse of Reaction A, and the signs of the thermodynamic properties have all been changed. Note that Reaction B is the formation reaction used to determine thermodynamic properties because one mole of ammonia is formed from its elements in their standard states. The values of ΔH° and ΔG° are the same values listed for ammonia in Thermodynamic Properties. However, ΔS° is different from the value for S° in the table. ΔS° in Reaction B is the standard entropy of formation of ammonia; but, as pointed out previously, the tables list the absolute entropies, not the entropies of formation.
4.6 Standard Free Energy and Equilibrium
Introduction
At a given temperature, ΔG° is a constant for a reaction, but ΔG varies with the concentrations of the reactants and products. In this section, we present the thermodynamic definitions of two important quantities: the equilibrium constant, which shows the fixed nature of ΔG°, and the reaction quotient, which expresses the variability of ΔG.
Objectives
•
Calculate the reaction quotient of a reaction given the activities of the reactants and the products.
•
Calculate the equilibrium constant of a reaction from the standard free energy of the reaction and vice versa.
•
Indicate the instantaneous direction of a reaction from the relative values of Q and K.
4.6-1. Free Energy and Activity
The free energy of a substance deviates from its standard free energy by the relationship shown in Equation 4.12.
( 4.12 )
G = G° + RT ln(a)
Free Energy and Activity
a in the above is called the activity of the substance. It indicates the extent to which the substance deviates from standard conditions. It is defined as the ratio of the concentration of the species to its concentration in its standard state, so it is unitless. The activity of substance A depends upon its state of matter as shown below.
•
a = 1 for solids and liquids because they are in their standard states
•
a = [A]/1 M when A is a solute because the standard state of a solute is a concentration 1 M
•
a = PA/1 atm when A is a gas because the standard state of a gas is a partial pressure of 1 atm
Since the activities of solutes and gases are numerically equal to their concentrations or partial pressures, their activities are represented by their molar concentrations and partial pressures in atmospheres, respectively.
4.6-2. Free energy and the reaction quotient
An absolute free energy cannot be determined from Equation 4.12
because the value of G° is not known, but the change in the standard free energy of a process can be determined because the difference in the standard free energy is frequently known. As an example, consider the variation of ΔG in the following reaction:
Cu(s) + 2 Fe3+(aq) → Cu2+(aq) + 2 Fe2+(aq)
The free energy change of the reaction is the free energy of the products minus the free energy of the reactants:
ΔG = {GCu2+ + 2 GFe2+} – {GCu + 2 GFe3+}
The ions are all solutes in aqueous solution, so their activities are represented by their molar concentrations. The activity of the solid is unity. Applying Equation 4.12
Next, we combine the first three terms by realizing that they represent ΔG° for the reaction and the last three terms by applying the relationship that ln x – ln y – ln z = ln(x/yz).
ΔG = ΔG° + RT ln
[Cu2+][Fe2+]2
(1)[Fe3+]2
Finally, we define the term in parentheses as the reaction quotient, which is represented by the symbol Q. Substitution of Q yields the result shown in Equation 4.13.
( 4.13 )
ΔG = ΔG° + RT ln Q
Free Energy and the Reaction Quotient
Note that different activities must sometimes be mixed in the reaction quotient. For example, consider the reaction: 2H1+(aq) + Fe(s) → H2(g) + Fe2+(aq). It involves two solutes in aqueous solution, a solid, and a gas, so the reaction quotient is
Q =
PH2[Fe2+]
[H1+]2(1)
=
PH2[Fe2+]
[H1+]2
4.6-3. The Standard Free Energy and the Equilibrium Constant
The value of Q for any reaction is obtained by raising the activity (pressure or concentration) of each substance to an exponent equal to its coefficient in the balanced chemical equation and then multiplying the results for the products and dividing by the results for the reactants. The reaction quotient can have any non-negative value. Indeed, it increases in a typical reaction because the numerator (product activity) is increasing and the denominator (reactant activity) is decreasing. However, it always has the same value at equilibrium. Its equilibrium value is called the equilibrium constant, K. Thus, Q and K are calculated using the same expression, but Q is a variable that changes as the reaction proceeds, while K is a constant for the reaction at a specified temperature. Consequently, ΔG = 0 and Q = K at equilibrium. Rewriting Equation 4.13
Application of the identity, ln x – ln y = ln(x/y), to the preceding yields Equation 4.16.
( 4.16 )
ΔG = RT ln
Q
K
Free Energy, the Equilibrium Constant, and the Reaction Quotient
Thus, the sign of ΔG is dictated by the relative magnitudes of Q and K. The second law states that the spontaneous direction of a reaction at constant pressure and temperature is that direction for which ΔG < 0. Consequently, the sign of ΔG (relative values of Q and K) indicates the spontaneous direction of the reaction. The following summarizes the possibilities.
•
If Q < K then ΔG < 0 and the reaction is proceeding to the right (→).
•
If Q = K then ΔG = 0 and the reaction is at equilibrium (⇌).
•
If Q > K then ΔG > 0 and the reaction is proceeding to the left (←).
4.6-7. Graphical View of Q, K, ΔG, and ΔG°
The standard free energy and the equilibrium constant for a reaction are functions of temperature only, but the free energy and reaction quotient are functions of concentrations as well.
Consider the following figure, which shows the variation of the free energy of the reaction A(g) → B(g) at 300 K as a function of the partial pressures of A (bottom axis) and B (top axis).
Figure 4.11: Free Energy for A → B
The spheres represent the position (composition) of the reaction as it "rolls" toward the minimum. The red lines at points 1, 3, and 4 represent the tangents to the curve at those points.
ΔG° and K are constants for this reaction at this temperature. Equilibrium lies at the minimum in the curve (Point 4), so the equilibrium pressures are PA = 0.20 atm (bottom scale) and PB = 0.80 atm (top scale). The equilibrium constant is
K =
PB
PA
=
0.80
0.20
= 4.0
ΔG° = GB° - GA° can be determined from the value of K with Equation 4.14
ΔG and Q vary as the reaction proceeds. The sphere on the curve represents reaction progress as it spontaneously moves toward the minimum. As it moves, the pressures of A and B change, which causes Q = PB/PA to change. Changes in Q are reflected in changes in ΔG as given by Equation 4.16
. Note that ΔG is related to the slope of the tangent at each point. At Point 1, the slope of the tangent is negative, so G < 0 and the reaction is spontaneous from left to right. The following table summarizes the points in the figure.
Point
PA
PB
Q
ΔG = RT ln(Q/K) (kJ·mol-1)
1
0.80
0.20
0.25
–6.9
2
0.70
0.30
0.43
–5.6
3
0.50
0.50
1.0
–3.5
4
0.20
0.80
4.0
0
Table 4.4
Note that as the reaction proceeds, Q gets larger and ΔG gets less negative. At Point 4, movement in either direction requires energy (ΔG = 0), so the reaction proceeds no further as equilibrium is established.
4.6-8. Graphical Exercise
Exercise 4.10:
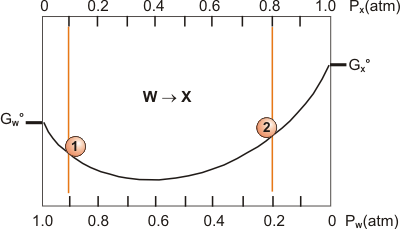
Use the accompanying diagram for the reaction W(g) → X(g) at 500 K.
(a) What is the sign of ΔG°?
+The standard free energy of the products is higher than that of the reactants.
Consider the following reaction: H2(g) + I2(g) ⇌ 2 HI(g) K = 623
Determine Q, the sign of ΔG, and the direction in which the reaction is proceeding at the following partial pressures.
H2 = 0.122 atm, I2 = 0.025 atm, HI = 1.77 atm
Q =1.0e3_0_2_Q = (1.772)/(0.122)(0.025) = 1.0e3
H2 = 0.362 atm, I2 = 0.188 atm, HI = 6.51 atm
Q =623_0__Q = (6.512)/(0.362)(0.188) = 623
ΔG:
+
–Q > K
~0Q > K
ΔG:
+Q = K, so reaction is at equilibrium.
–Q = K, so reaction is at equilibrium.
~0
Direction:
left
rightQ > K, so reaction proceeds back to the left.
at equilibriumQ > K, so reaction proceeds back to the left.
Direction:
leftQ = K, so there is no net reaction.
rightQ = K, so there is no net reaction.
at equilibrium
4.6-10. ΔG vs. ΔG°
Consider the following process:
H2O(l) → H2O(g) ΔG°vap = +8.6 kJ/mol at 25 °C
The above is often misinterpreted to mean that the evaporation is not spontaneous at this temperature. However, water can evaporate spontaneously at 25 °C. The problem with the misinterpretation is that spontaneity is based on ΔG not on ΔG°. The standard state of water vapor is 1 atm pressure, so the fact that ΔG > 0 simply means water vapor would condense (reaction would go left to right) if its pressure were 1 atm at 25 °C. The equilibrium pressure (vapor pressure) of water at this temperature is only 23.8 torr, which means that it will never evaporate spontaneously to a pressure greater than 23.8 torr at 25 °C. This difference is examined in the next example.
4.6-11. Signs of ΔG and ΔG° Exercise
Exercise 4.12:
The temperature of an equilibrium mixture of liquid and vapor water is changed very quickly to 75 °C. Immediately after the change, the pressure of vapor in the container is 375 torr. The vapor pressure of water at 75 °C is 289 torr.
Qualitative treatment of ΔG and ΔG°
What is the sign of ΔG for the process H2O(l) → H2O(g) under these conditions?
+
–Q = 375 torr and K = 289 torr, so Q > K, which makes ΔG > 0.
~0 Q = 375 torr and K = 289 torr, so Q > K, which makes ΔG > 0.
What is the sign of ΔG° for the process H2O(l) → H2O(g) under these conditions?
Although the absolute entropy of a substance is temperature dependent, ΔS° often varies only slightly with temperature because the entropies of the reactants and products vary in the same direction. Similar considerations apply to the enthalpy. In this section, we examine the temperature dependence of both the standard free energy and the equilibrium constant of a chemical reaction by assuming that both the enthalpy and entropy terms do not vary.
Objectives
•
Estimate the value of ΔG° at temperatures other than 298 K from ΔH° and ΔS° values.
•
Estimate the boiling point of a liquid from thermodynamic data.
•
Determine the equilibrium constant at one temperature given the equilibrium at another temperature and the enthalpy of reaction.
4.7-1. Linear Relationship of ΔG vs K
The variation of ΔG with temperature can be seen by rewriting Equation 4.8ΔG = ΔH – TΔS = –TΔSuniv in the form of a linear equation (y = mx + b).
ΔG = (−ΔS)T + ΔH
Thus, a plot of ΔG versus T is a straight line with a slope of –ΔS and an intercept of ΔH. ΔG = 0 = ΔH – TΔS where the two driving forces are equal and opposed; i.e., where ΔH = TΔS. The temperature where they are equal is obtained by solving for T.
( 4.17 )
ΔT =
ΔH
ΔS
Temperature at which ΔG = 0
4.7-2. The Graph of ΔG vs. T
Consider the variation of the free energy with temperature for Processes A - E shown in Figure 4.12.
Figure 4.12: Temperature Variation of the Free Energy
Line A: ΔH > 0, ΔS > 0: A positive intercept means that ΔG > 0 at low temperature, but the negative slope means that it becomes less positive with increasing temperature. Thus, the process is not spontaneous at low temperature because there is not enough TΔS energy released to overcome the positive ΔH. However, at high temperature, sufficient TΔS energy is available and the process becomes spontaneous.Line B: ΔH > 0, ΔS < 0: Both driving forces are unfavorable, so both require energy. In the absence of energy from an outside source, this process cannot occur; i.e., the process is not spontaneous at any temperature.Line C: ΔH < 0, ΔS < 0: At low T, there is sufficient energy liberated by the ΔH term to drive the unfavorable TΔS term. However, as the temperature increases, the TΔS term becomes more important. Eventually, –TΔS > ΔH and the reaction is no longer spontaneous. The temperature at which the TΔS and ΔH terms are the same can be found with Equation 4.17
. Line D: ΔH < 0, ΔS > 0: Both terms are favorable, so this process is spontaneous at all T.Line E: ΔH < 0, S ~ 0: It is often the case that ΔS ~ 0 compared to ΔH. When that occurs, the spontaneity is dictated solely by ΔH. In line E, ΔS ~ 0, while H < 0, so this process is always spontaneous.
4.7-3. Temperature and Spontaneity Table
Predicting Reaction Spontaneity
ΔH
ΔS
Spontaneity
T where ΔG = 0
+
+
Not at low T, but it is at high T
If we assume that ΔH = +10 kJ and ΔS = +20 J·K–1,
we can use Equation 4.17 to determine that T = (10 kJ)/(0.02 kJ)·K–1 = 500K.
Reaction is not spontaneous below 500 K, but it is above 500 K.
+
–
Both terms are unfavorable, so this process is never spontaneous.
No T
–
–
At low T, but not at high T
If we assume that ΔH = –50 kJ, ΔS = –50 J·K–1,
we can use Equation 4.17 to determine that T = (–50 kJ)/(–0.05 kJ·K–1) = 1000 K.
Reaction is spontaneous below 1000 K, but not above.
–
+
Both terms are favorable, so this process is always spontaneous.
All T
Table 4.5: Predicting Reaction Spontaneity
4.7-4. ΔG° vs T
The variation of ΔG° with temperature is given by ΔG° = (–ΔS°)T + ΔH°. Thus, a plot of ΔG° versus T is a straight line with a slope of –ΔS° and an intercept of ΔH°. Such a plot is shown in Figure 4.13. It is identical to Figure 4.12. except that superscripts have been added to all thermodynamic quantities and 'spontaneous' has been replaced with 'extensive' to reflect the difference between ΔG and ΔG°.
Figure 4.13: Temperature Variation of the Standard Free Energy
Predicting Extent of Reaction
ΔH
ΔS
Extent
+
+
Not extensive at low T, but the extent does increase with temperature.
+
-
Both terms are unfavorable, so this process is never extensive. It becomes less extensive with temperature increases.
-
-
Extensive at low T, but the extent decreases with increasing temperature
-
+
Both terms are favorable, so this process is always extensive.
Table 4.6: Predicting Extent of Reaction
4.7-5. ΔG° and K at Temperatures other than 298 K Exercise
Exercise 4.13:
Assume that ΔH° = –92.22 kJ and ΔS° = –198.6 J·K–1 are temperature independent to estimate ΔG° at 435 K and 635 K for the reaction N2(g) + 3 H2(g) → 2 NH3(g).
435 K
ΔG° =-5.83_0__Use Equation 4.8. Be sure to convert the entropy units to kJ·K–1. ΔG° = –92.22 – (435)(–0.1986)kJ
K =5.0_0_2_Use Equation 4.15. Be sure that ΔG° and RT have the same units. K = exp(5830)/(8.314)(435) = exp(+1.61) = 5.0
635 K
ΔG° =34_0__Use Equation 4.8. Be sure to convert the entropy units by kJ·K–1. ΔG° = –92.22 – (635)(–0.1986)kJ
K =0.53_0__Use Equation 4.15. Be sure that ΔG° and RT have the same units. K = exp(–3400)/(8.314)(635) = exp(–0.644) = 0.53
4.7-6. Boiling Points
A boiling point can be estimated from the heat and entropy of vaporization.
The (normal) boiling point is defined as the temperature at which the vapor pressure is 1 atm, and vapor pressure is the pressure of the vapor in equilibrium with the liquid at a given temperature. Thus, the (normal) boiling point is the temperature at which the equilibrium pressure of the vapor is 1 atm. It is an equilibrium process, so the free energy of vaporization, ΔGvap, is zero. In addition, the pressure of the vapor is 1 atm, so it is an equilibrium at standard conditions, and we may write that ΔG°vap = 0 at the (normal) boiling point (Tbp). Substituting zero for ΔG°vap in Equation 4.8ΔG = ΔH – TΔS = –TΔSuniv yields
0 = ΔH°vap – TbpΔS°vap
or
ΔH°vap = TbpΔS°vap
Solving for T, the boiling point in Kelvins, we obtain Equation 4.18:
( 4.18 )
Tbp =
ΔH°vap
ΔS°vap
Boiling Points
4.7-7. Boiling Point Exercise
Exercise 4.14:
Given that ΔH°vap = 44.01 kJ/mol and ΔS°vap =118.8 J·mol–1·K–1 for water, estimate the normal boiling point of water to the nearest degree Celsius.
T =97_0__Make certain that ΔH° and ΔS° have the same energy units (either J or kJ).
T =
ΔH°vap
ΔS°vap
=
44.01 kJ/mol
0.1188 kJ/mol·K
= 370 K = 97 °C
°C
4.7-8. T Dependence of K
Enthalpy is the source of the temperature dependence of the equilibrium constant.
Dividing both sides by –RT leads to the following:
( 4.19 )
ln K =
ΔS°
R
−
ΔH°
RT
ln K as a Function of Temperature
ln K increases with T when ΔH° > 0 (endothermic reactions), but decreases with T when ΔH° < 0 (exothermic reactions). If ΔS° and ΔH° are temperature independent, then a plot of the ln K versus 1/T should be a straight line with a slope of ΔS°/R and an intercept of –ΔH°/R. Such plots are commonly used to determine ΔH° and ΔS°.
4.7-9. Determining K at a T Given Its Value at Another T
If the enthalpy and entropy of reaction are assumed to be temperature independent, we can write the equilibrium constants at two different temperatures as
ln(K1) =
ΔS°
R
−
ΔH°
RT1
and ln(K2) =
ΔS°
R
−
ΔH°
RT2
Subtracting the two expressions above to obtain ln(K2) – ln(K1) and solving the resulting expression for ln(K2), we obtain the desired result shown in Equation 4.20.
( 4.20 )
ln(K2) = ln(K1) +
ΔH°
R
1
T1
−
1
T2
K at Different Temperatures
Thus, if the enthalpy of reaction at one temperature (K1 at T1) is known, then the equilibrium constant can be determined at another temperature if ΔH° is also known.
4.7-10. Exercise
Exercise 4.15:
Estimate ΔG° at 0 °C and estimate K for 2 NO2(g) → N2O4(g) using both Equation 4.15
Estimate K500 for N2(g) + 3 H2(g) ⇌ 2 NH3(g) given K298 = 6.1 × 10⁵ and ΔH°298 = –92.22 kJ·mol–1.
K500 =0.18_0__
ln K = ln 6.1e+05 −
92,220 J
8.3174 J/mol·K
×
1
298
−
1
500
= −1.72
K = e–1.72 = 0.18
4.8 Coupled Reactions
Introduction
A thermodynamically unfavorable reaction can be driven by a thermodynamically favorable one that is coupled to it. In this section, we consider two important examples: the smelting of iron ore and the use of adenosine triphosphate (ATP) in biological systems.
Objectives
•
Calculate the free energy of reaction from the free energies of two reactions that can be coupled to produce the desired reaction.
4.8-1. Smelting of Iron Ore
The largest source of iron is the ore hematite (Fe2O3) but to get the iron from direct decomposition is thermodynamically unfavorable by a substantial amount (Reaction 1).
Fe2O3(s) → 2 Fe(s) + 3/2 O2(g) ΔG° = +742.2 kJ
Reaction 1
There must be an input energy to drive Reaction 1 in the unfavorable direction, and CO is used to supply the energy in a blast furnace because the oxidation of CO liberates free energy as shown in Reaction 2.
CO(g) + 1/2 O2(g) → CO2(g) ΔG° = –257.2 kJ
Reaction 2
Reactions 1 and 2 are coupled in a blast furnace. Hess's law of heat summation can be used to determine ΔG° of the overall reaction. In order to cancel the 3/2 O2 formed in Reaction 1, we multiply Reaction 2 by 3. The two coupled reactions are
Summing the two coupled reactions and their standard free energies yields the net thermochemical reaction for the smelting of iron ore shown in Reaction 3.
The negative value of ΔG° means that the reaction is extensive at 298 K.
4.8-2. ATP
The human body couples the reactions of high-energy molecules that undergo exothermic reactions with thermodynamically unfavorable reactions to produce favorable ones. The most important of these energy containing molecules is adenosine triphosphate, which exists in the body as a 4– ion and is abbreviated as ATP4– or simply ATP.
Figure 4.14: Adenosine Triphosphate (ATP)
4.8-3. ATP to ADP Conversion
The repulsion of the three negatively charged phosphate groups makes the P-O-P bonds very weak, which makes ATP an energy-rich ion. As shown in Reaction 4 and Figure 4.15, the terminal phosphate group is readily removed by water to form adenosine diphosphate (ADP3– or ADP). The 30.5 kJ/mol of free energy that is released in this reaction is used by all living organisms to drive non-spontaneous reactions.
ATP4– + H2O → ADP3– + HPO42– + H1+
Reaction 4
Figure 4.15: ATP to ADP
4.8-4. Combustion of Glucose Thermodynamics
As another very important example of coupled reactions, consider the combustion of glucose, which is the primary source of energy in all oxygen-using organisms.
The release of such a large amount of energy in an uncontrolled reaction would be wasteful and destroy cells. Consequently the body extracts the energy in sequential chemical reactions that allow it to harvest the energy a little at a time. Part of the energy is released in the form of heat, which helps maintain the body temperature. Part of the overall reaction for the combustion of glucose in the body is
C6H12O6 + 6 O2 + 36 ADP + 36 H3PO4→ 6 CO2 + 36 ATP + 42 H2O
Much of the energy of the above reaction is stored in the 36 molecules of ATP that are produced.
4.8-5. Mechanism of Glucose Combustion
The process shown in Figure 4.16 (a) is not extensive (ΔG° = +13.8 kJ) in the absence of ATP due to the strength of the P-O bond that must be broken. However, placing a phosphate on glucose can be made extensive (ΔG° = –16.7 kJ) by coupling it with the ATP ⇌ ADP conversion shown in Figure 4.15 to produce the extensive reaction shown in Figure 4.16 (b) with ΔG° = –16.7 kJ. The coupled reaction is much more extensive because the P-O bond that is broken is much weaker in the highly energetic ATP ion than in the HPO2–4 ion.
Figure 4.16: Formation of Glucose Phosphate from Glucose
Most of the remaining steps in the glucose oxidation are down hill in free energy, and much of the energy is used to convert ADP back into ATP. ATP is a short-lived species in the cell as it is usually consumed within a minute of being formed. During strenuous activity, ATP can be used at a rate of up to 0.5 kg/min.
4.9 Exercises and Solutions
Select the links to view either the end-of-chapter exercises or the solutions to the odd exercises.