Qualitative and Quantitative Problems Qualitative and Quantitative Problems |
Hands-On Activities and Discussion Questions
The questions and activities in this group are particularly suitable for in-class use.
2-1.
Hands-On Activity.
 |
|
a.
|
Throw a ball vertically up in the air so that it rises about 1 m after leaving your hand. Does it slow down as it rises? Does
it speed up as it falls? Can you see this happening, or is it too difficult to judge because things happen so fast?
|
|
|
b.
|
Now find a table top (or a board or other flat surface) that is at least 1 m long and that you can tilt by propping up one
end. Tilt it very slightly, just barely enough so that a ball rolled uphill on the tilting surface will roll back down. Roll
the ball so that it goes about 1 m up the tilting surface before turning around. Now can you see whether the ball slows down
on its way uphill? Can you see whether the ball speeds up on its way downhill? Comment on your observations.
|
|
|
2-2.
Discussion Question. A car manufacturer launches a new advertising campaign claiming that its cars are capable of accelerations of 30 000 miles/hr2. Is this an outrageous claim?
Review and Practice
SSM Solution is in the Student Solutions Manual
WWW Solution is at http://www.wiley.com/college/touger
Section 2-1
Matter in Motion
2-3.
How can you think of each of the following as involving matter in motion? (You are not expected to give a full explanation
here. Simply think about what in each situation must have moved or been rearranged, and indicate why. In some of these situations,
it will be helpful to think about the atoms or molecules. Also indicate what in each situation is unclear to you.)
|
|
a.
|
About a week after you see a half moon on a particular night, the moon appears full.
|
|
|
b.
|
A beaker of ammonia spills in a chemistry lab. The students closer to it smell it before those who are further away.
|
|
|
c.
|
When some cold milk is added to a child's too-hot cocoa, everything reaches a drinkable in-between temperature.
|
|
|
d.
|
Green plants form glucose, a simple sugar, from water and carbon dioxide.
|
|
|
Section 2-2
A Vocabulary for Describing Motion
2-4.
Can you treat a baseball as a point object when you are analyzing a. the path of a batted ball hit over the right field wall? b. how a pitcher makes the ball curve?
2-5.
SSM Assume that the given values in Figure 2-2 are in km (103 m).
|
|
a.
|
What is the position of a car according to a Newtonville observer when a Keplertown observer reports that it is −40 km? When a Keplertown observer reports that it is zero?
|
|
|
b.
|
If the car travels from the first of these positions to the second, what is its displacement according to the Newtonville
observer? According to the Keplertown observer?
|
|
|
2-6.
In the room where you are now working, identify the wall closest to you.
|
|
a.
|
If the origin is at the point on this wall nearest to you, what is your approximate position?
|
|
|
b.
|
If the origin is at the point on the opposite wall nearest to you, and you choose the same direction as positive, what is your approximate position? Draw a sketch that shows your reasoning for both a and b.
|
|
|
c.
|
Walk 1 m toward the opposite wall. How would you now answer a? b? What is your displacement for each choice of origin?
|
|
|
d.
|
What distance have you gone for each choice of origin?
|
|
|
2-7.
Find the displacement of a jogger who follows a straight path
|
|
a.
|
from a position of 100 m to a position of 600 m.
|
|
|
b.
|
from a position of 600 m to a position of 100 m.
|
|
|
c.
|
from a position of −100 m to a position of −600 m.
|
|
|
d.
|
from a position of −600 m to a position of −100 m.
|
|
|
2-8.
Find the distance gone by the jogger in each part of Problem 2-7.
2-9.
For each of the following straight-line motions, show the positions on a real number line and sketch the displacement, showing
both its direction and its value. Assume east is the positive direction in each case and that the origin is at the stoplight.
|
|
a.
|
A car starts out 250 m east of the light and ends up 350 m east of the light.
|
|
|
b.
|
A bicyclist starts out 250 m west of the light and ends up 350 m east of the light.
|
|
|
c.
|
A delivery truck starts out 250 m east of the light and ends up 350 m west of the light.
|
|
|
d.
|
A pedestrian starts out 250 m west of the light and ends up 350 m west of the light.
|
|
|
2-10.
In Problem 2-7, assume in each part that the initial position occurs when the jogger's stopwatch reads 30 s and the final position occurs
when the watch reads 280 s.
|
|
a.
|
Find the jogger's average velocity and average speed in Problem 2-7a.
|
|
|
b.
|
Find the jogger's average velocity and average speed in Problem 2-7b.
|
|
|
c.
|
Find the jogger's average velocity and average speed in Problem 2-7c.
|
|
|
d.
|
Find the jogger's average velocity and average speed in Problem 2-7d.
|
|
|
e.
|
The jogger's speed when the watch reads 100 s (is 0.5 m/s; is −0.5 m/s; is 2 m/s; is −2 m/s; is 5 m/s; is −5 m/s; or cannot be calculated).
|
|
|
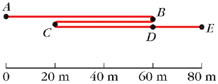
2-11.
A walker follows the path from A to E (Figure 2-22) over an 80-s time interval.
|
|
a.
|
What total distance does the walker cover between A and E?
|
|
|
b.
|
What is the walker's total displacement between A and E?
|
|
|
c.
|
What is the walker's average velocity between A and E?
|
|
|
d.
|
What is the walker's average speed between A and E?
|
|
|
e.
|
What is the walker's average velocity between points B and D?
|
|
|
f.
|
What is the walker's average speed between B and D?
|
|
|
2-12.
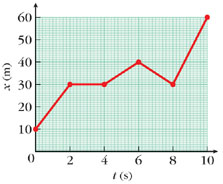
A test vehicle is being developed that can react almost instantaneously to objects in its path. Its position x during one trial is graphed against clock reading t in Figure 2-23. What is the vehicle's average
|
|
a.
|
velocity between t = 4 s and t = 6 s?
|
|
|
b.
|
velocity between t = 6 s and t = 8 s?
|
|
|
c.
|
velocity between t = 4 s and t = 8 s?
|
|
|
d.
|
speed for the interval in a?
|
|
|
e.
|
speed for the interval in b?
|
|
|
f.
|
speed for the interval in c?
|
|
|
g.
|
velocity between t = 0 and t = 10 s?
|
|
|
h.
|
speed during this interval?
|
|
|
2-13.
SSM WWW The position of a test vehicle is plotted against clock reading t in Figure 2-23. Consider the vehicle's average velocity during each of the following time intervals: from t = 6 s to t = 8 s; from t = 2 s to t = 4 s; from t = 4 s to t = 8 s; from t = 0 to t = 2 s. Put the intervals in rank order according to average velocity, starting with the value (lowest or most negative) that
would occur farthest to the left on a real number line. Make sure to indicate equalities if there are any.
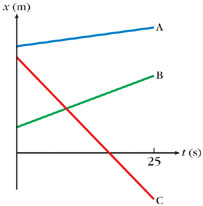
2-14.
In Figure 2-24, the positions of three travelers A, B, and C are plotted against clock reading t over a 25-s time interval.
|
|
a.
|
List these travelers in rank order of their velocity during this time interval, starting with the value (lowest or most negative) that would occur furthest to the left on a real
number line. Make sure to indicate equalities if there are any.
|
|
|
b.
|
List these travelers in rank order of their speed during this time interval, starting with the value (lowest or most negative) that would occur furthest to the left on a real
number line. Make sure to indicate equalities if there are any.
|
|
|
2-15.
SSM In Figure 2-23, which records the motion of a test vehicle, what is the instantaneous velocity of the vehicle
|
|
a.
|
at t = 1 s?
|
|
|
b.
|
at t = 7 s?
|
|
|
c.
|
at t = 9 s?
|
|
|
2-16.
A commuting student rushing to get home before her children get home from school has left campus and is 200 m beyond the college
gate at exactly 2:19:20 PM (in hours, minutes, seconds). The bus stop is 1100 m beyond the gate in the same direction. The last bus that will get her
home in time departs promptly at 2:23:00 PM. She runs the remaining distance at a constant speed of 3.9 m/s.
|
|
a.
|
Determine by a calculation whether she is running fast enough to catch her bus. (Also, does she have exact change when she
gets there?)
|
|
|
b.
|
Suppose that the 3.9 m/s had been an average speed rather than a constant speed. Would that have any effect on your answer
to a? Explain.
|
|
|
2-17.
A college student is driving home for spring break along a straight highway. When she is 20 000 m from the college, she sets
her cruise control at 25 m/s and starts a stopwatch that she has borrowed from her physics lab. What does the watch read when
she is 50 000 m from the college in the same direction?
Section 2-3
Representing Motion Graphically
2-18.
A storm front advances eastward at a constant speed of 9.2 km/h. A meteorologist notes from satellite photos that at t = 2.0 h, the storm front has reached a point 13.8 km east of his weather station.
|
|
a.
|
Where was the storm front at t = 0
|
|
|
b.
|
If the weather station is at x = 0, what is the value of the vertical intercept of a graph of x versus t?
|
|
|
c.
|
Sketch the graph.
|
|
|
2-19.
A student in a high-rise residence hall is disgruntled because an elevator descending at constant speed fails to stop at his
floor. When he pushes the button, the elevator is 6.4 m above him; 5.0 s later, it is 9.6 m below him.
|
|
a.
|
If the upward direction is positive, what is the velocity of the elevator?
|
|
|
b.
|
What is the slope of a graph of the elevator's position (plotted vertically) versus t?
|
|
|
c.
|
Sketch the graph.
|
|
|
2-20.
Consider Figure 2-8b. For which 1-s interval (0 to 1 s, 1 s to 2 s, 2 s to 3 s, or 3 s to 4 s) is the average velocity
|
|
a.
|
of car C a maximum?
|
|
|
b.
|
of car C a minimum?
|
|
|
c.
|
of car D a maximum?
|
|
|
d.
|
of car D a minimum?
|
|
|
2-21.
Figure 2-8a shows the position versus time graphs of five race cars.
|
|
a.
|
Suppose you wanted to know during which 1-s interval (0 to 1 s, 1 s to 2 s, etc.) car C had its maximum average velocity.
How is this information communicated by the graph for car C?
|
|
|
b.
|
Repeat a for car D.
|
|
|
2-22.
In Figure 2-25, match each graph of velocity v versus t with the graph that plots position x versus t for the same motion.
2-23.
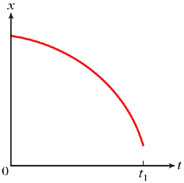
In the v versus t graph in Figure 2-9b, the velocity is negative between t = 0 and t = t1. What feature of Figure 2-9a (the x versus t graph of the same object) tells you that the velocity is negative between these two instants?
2-24.
Sketch the v versus t graph for each of the x versus t graphs in Figure 2-26.
Section 2-4
Acceleration and Graphing Uniformly Accelerated Motion
2-25.
Converting units.
|
|
a.
|
A car manufacturer launches a new advertising campaign claiming that its cars are capable of accelerations as great as 20
000 miles/hr2. Is this an outrageous claim?
|
|
|
b.
|
The specs on a 2000 Volkswagen Jetta indicate that it can go from zero to 60 miles/hr in 7.6 s. Find its average acceleration
in units of (miles/hr)/s.
|
|
|
c.
|
Convert the acceleration that you found in b to (miles/hr)/hr (or miles/hr2). Think about how this compares to the car in a, and whether you would still give the same answer to part a.
|
|
|
2-26.
Consider the equations x = xo + vt and v = vo + at.
|
|
a.
|
Do a feature-by-feature comparison of the graphs of these two equations.
|
|
|
b.
|
Under what conditions can each of these equations be used? Can the two equations be used together under the same conditions?
|
|
|
2-27.
SSM WWW Sketch a graph of acceleration a versus t for each of the following cars.
|
|
a.
|
Car A starts from rest and speeds up uniformly toward the east.
|
|
|
b.
|
Car B travels westward at a constant speed of 10 m/s.
|
|
|
c.
|
Car C starts out at a speed of 10 m/s due east and slows down uniformly.
|
|
|
d.
|
Car D starts from rest and speeds up uniformly toward the west.
|
|
|
2-28.
In the motion graphed in Figure 2-14, does the acceleration increase, decrease, or remain the same as t increases?
2-29.
SSM For the v versus t graph in Figure 2-14, find the approximate instantaneous acceleration at t = 7.5 s.
Section 2-5
Constant Acceleration and Equations of Motion
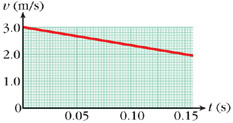
2-30.
In the graph in Figure 2-27, the velocity of a ball rolling on a ramp is plotted against time.
|
|
a.
|
Find the ball's initial velocity.
|
|
|
b.
|
Find the ball's acceleration.
|
|
|
c.
|
Use your results to determine the time at which the velocity will be −4.0 m/s if the acceleration remains uniform.
|
|
|
2-31.
What happens to Equations 2-9 through 2-12 when a = 0? Write the resulting equations and interpret them.
2-32.
|
|
a.
|
Is it possible for an object with constant acceleration to slow down and then speed up again? Explain.
|
|
|
b.
|
Is it possible for an object with constant acceleration to speed up and then slow down again? Explain.
|
|
|
2-33.
A child rolls a ball up a playground slide. The ball has constant acceleration once it leaves the child's hand, and it passes
a certain spot on the slide both on its way up and on its way down.
|
|
a.
|
Does the ball have the same velocity each time it passes the spot? Explain.
|
|
|
b.
|
Does the ball have the same speed each time it passes the spot? Explain.
|
|
|
2-34.
A car starts at rest at the origin when the driver's stopwatch reads t = 0 and accelerates uniformly in the positive x direction. When the car has gone a certain distance d1, it has a speed v1 and the stopwatch reading is t1. When the car has gone twice this distance, it has a speed v2 and the stopwatch reading is t2.
|
|
a.
|
Will v2 be equal to twice v1, greater than twice v1, or less than twice v1? Explain.
|
|
|
b.
|
Will t2 be equal to twice t1, greater than twice t1, or less than twice t1? Explain.
|
|
|
2-35.
A driver begins to brake when her car is traveling at 15.0 m/s, and the car comes to a stop 4.0 s later. How much further
does the car go after she begins to brake, assuming the acceleration is constant?
2-36.
A truck starting from rest along a straight road has an acceleration of 2.0 m/s2.
|
|
a.
|
What is its speed after 1 s? 2 s? 3 s?
|
|
|
b.
|
How far has it gone after 1 s? 2 s? 3 s?
|
|
|
2-37.
SSM WWW A subway train starting from rest along a straight track has a uniform acceleration of 1.8 m/s2 for the first 20 m it travels.
|
|
a.
|
Calculate its speed when it has traveled 10 m.
|
|
|
b.
|
When it has traveled 20 m, will its speed be less than double, double, or more than double its speed at 10 m? (Answer this
before doing a calculation.)
|
|
|
c.
|
Now calculate its speed when it has traveled 20 m. Does this agree with your answer to b?
|
|
|
Section 2-6
Solving Kinematics Problems I: Uniform Acceleration
2-38.
A certain vehicle requires a distance of 30 m to stop when it is traveling at 25 m/s.
|
|
a.
|
What acceleration is produced by braking under these conditions?
|
|
|
b.
|
If a jaywalker is 28 m in front of the vehicle when the driver first applies the brakes, how much time does the pedestrian
have to get out of the way?
|
|
|
2-39.
A car starting from rest is given a constant acceleration of 4 m/s2.
|
|
a.
|
What is its speed when it has gone a distance of 50 m?
|
|
|
b.
|
How long does it take to go this distance?
|
|
|
2-40.
A ball is rolled up a long, sloping driveway with an initial velocity of 4 m/s. The absolute value of the ball's acceleration
is 2 m/s2. Assume the ball's initial position is zero and the uphill direction is positive.
|
|
a.
|
Find the ball's velocity every second from t = 0 to t = 6 s.
|
|
|
b.
|
Find the ball's position every second from t = 0 to t = 6 s.
|
|
|
c.
|
During this time period, at how many different instants does the ball have a speed of 2 m/s?
|
|
|
d.
|
During this time period, at how many different instants does the ball have a speed of 6 m/s?
|
|
|
2-41.
|
|
a.
|
Sketch a graph of velocity versus time using the values from Problem 2-40a.
|
|
|
b.
|
Sketch a graph of position versus time using the values from Problem 2-40b.
|
|
|
2-42.
A ball is rolled up a ramp with an initial velocity of 10 m/s. The absolute value of the ball's acceleration is 2 m/s2.
|
|
a.
|
How far up the ramp does the ball go?
|
|
|
b.
|
How long does it take the ball to reach this point?
|
|
|
c.
|
If the ball starts out at t = 0, at how many different instants t will it be at a point 9 m from its starting position—zero, one, or two? (Answer this before doing a calculation.)
|
|
|
d.
|
If the ball starts out at t = 0, when will it be 9 m from its starting position? What will its velocity be at each instant? Answer this by doing a calculation,
and see if your result agrees with your answer to c.
|
|
|
2-43.
A test driver starts her timer and begins to accelerate uniformly as she passes the zero marker on a posted straightaway.
She passes the 40-m mark when her timer reads 2 s, and the 60-m mark when her timer reads 4 s. Find her velocity at the zero
marker and her acceleration.
2-44.
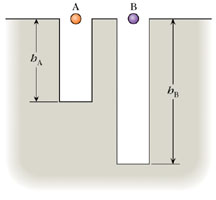
Identical balls A and B are released at the openings of the hollow vertical shafts in Figure 2-28. The balls strike the bottoms of the two shafts at speeds vA and vB, respectively. Suppose we know that vB = 2 vA, and air resistance is negligible.
Section 2-7
Gravitational Acceleration and Free Fall
2-45.
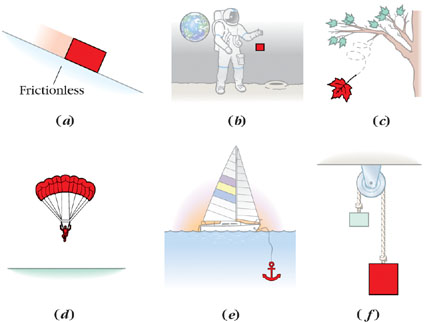
Which of the highlighted objects shown in Figure 2-29 are freely falling (or very nearly so)?
2-46.
A child's toy rocket is propelled straight upward by releasing a compressed spring. At which (one or more) of the following
instants is the rocket's acceleration equal to −9.8 m/s2 (assuming the upward direction is positive and neglecting air resistance)? Explain.
|
|
a.
|
t1: just before the rocket loses contact with the spring.
|
|
|
b.
|
t2: just after the rocket loses contact with the spring.
|
|
|
c.
|
t3: when the rocket reaches the highest point of its ascent.
|
|
|
d.
|
t4: when the rocket is on its way back down to the ground
|
|
|
2-47.
Two rocks are dropped from rest and fall freely from the same horizontal railing. If the second falls for twice as much time
as the first, how many times as far does it fall?
2-48.
A penny dropped from the top of the No-Trump Tower would hit the pavement below in 6.8 s. How tall is the No-Trump Tower?
2-49.
SSM A stunt man in a movie action scene is propelled straight up in the air with a velocity of 14.4 m/s.
|
|
a.
|
How high does he go?
|
|
|
b.
|
How long does he remain in the air, assuming he is in free fall until he reaches the ground again?
|
|
|
2-50.
A rocket is launched upward from atop the edge of a cliff at t = 0. It has an initial velocity of 39.2 m/s. It just misses the edge of the cliff on the way down.
|
|
a.
|
Find its position and velocity at 2-s intervals from t = 0 to t = 10 s.
|
|
|
b.
|
How high above or below the edge of the cliff is the rocket when its velocity is zero?
|
|
|
2-51.
For the motion described in Problem 2-50, sketch a graph of the rocket's
|
|
a.
|
velocity versus time from t = 0 to t = 10 s.
|
|
|
b.
|
position versus time from t = 0 to t = 10 s.
|
|
|
c.
|
acceleration versus time from t = 0 to t = 10 s.
|
|
|
2-52.
The gravitational acceleration on the moon is about one-sixth what it is at Earth's surface  Let tmoon be the time it takes a rock dropped from rest to hit the moon's surface, and tEarth be the time for a rock dropped from rest from the same height to hit Earth's surface. Find the numerical value of the ratio
 .
.
Going Further
The questions and problems in this group are not organized by section heading, so you must determine for yourself which ideas
apply. Some of them will be more challenging than the Review and Practice questions and problems (especially those marked
with a  or ).
or ).
2-53.
|
|
a.
|
A lens mounted on a straight calibrated track is moved from a position of −0.30 m to a position of +0.25 m. Find its displacement.
|
|
|
b.
|
Find the displacement of the lens when it is moved from a position of +0.30 m to a position of −0.25 m.
|
|
|
2-54.
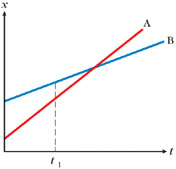
The positions of two bodies A and B are plotted over the same time interval in Figure 2-30. Is A or B moving faster at time t1? Briefly explain. (This and the following problem are adapted from materials by Lillian C. McDermott and the University of
Washington physics education group.)
2-55.
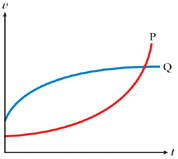
Two bodies P and Q move along the same straight line. Their velocities are plotted over the same time interval in Figure 2-31. What information does this graph provide about whether P and Q collide? (See note on previous problem.)
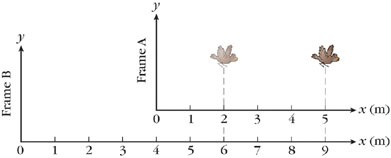
2-56.
According to coordinate frame A (Figure 2-32), a sparrow flies from x = 2 m to x = 5 m at constant speed. Which of the following quantities change if we consider things from the point of view of coordinate
frame B? The sparrow's initial position, the sparrow's final position, the sparrow's displacement, the sparrow's velocity.
Explain.
2-57.
Converting units. Many U.S. highways have a speed limit of 65 miles/hour. Using the fact that 1 mile =1609 m, what is this speed limit in
SI units of m/s?
2-58.
American baseball does not use SI units. A typical Major League pitcher throws a 90 mi/hr fastball and an 80 mi/hr change-up.
The distance from the point where the ball leaves his hand to home plate is 55 feet. (Based on data from Robert Beck/ Allsport
USA as published in G. F. Will, Men at Work, Macmillan, NY 1990.)
|
|
a.
|
How much more time (in seconds) does a batter have to react to a change-up than to a fastball?
|
|
|
b.
|
Suppose that the ball can be struck by the bat over about 2 feet of the pitched ball's path. How long a time interval does
the bat have to make contact with a 90 mi/hr fastball?
|
|
|
2-59.
Albatrosses, large seabirds of the Southern Hemisphere, have been known to circumnavigate the globe by gliding on prevailing
winds. At 40° south latitude, the distance around Earth is about 3 × 10⁷ m. Riding winds averaging 5 m/s (about 11 knots, actually light for this region), how long would it take an albatross to
complete a trip around the world? Convert your result to days.
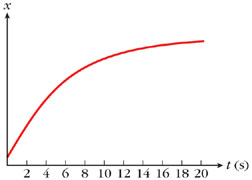
2-60.
A marine biologist shooting a video of a rare species of fish uses the video data to produce the graph of the fish's position
x plotted against clock reading t in Figure 2-33.
|
|
a.
|
What is the fish's average velocity between t = 0 and t = 8 s?
|
|
|
b.
|
between t = 8 s and t = 10 s?
|
|
|
c.
|
between t = 0 and t = 10 s?
|
|
|
d.
|
Is your answer to c the average of your answers to a and b? Explain.
|
|
|
e.
|
What is the instantaneous velocity at t = 8 s?
|
|
|
f.
|
Estimate the instantaneous velocity at t = 5 s.
|
|
|
2-61.
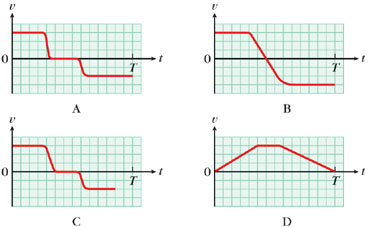
SSM A driver pulls out of his driveway, drives east at constant speed to pick up his daughter at school, and stops to chat with
his daughter's teacher for a few minutes. Returning home, he must drive at a slower constant speed because westbound traffic
is heavier. He finally pulls back into his driveway at time T. Which graph of velocity versus t in Figure 2-34 most accurately represents this round trip?
2-62.
An assembly line worker runs to get a replacement part (100 m away) in 15 s and then takes 20 s to run back again. Find his
average velocity a. for the first 100 m. b. for the second 100 m. c. for the total run. d. Do you get the answer to c if you just average your answers to a and b? Explain why, or why not.
2-63.
A dog starts at its owner's feet, runs to fetch a stick 20 m away, then returns the stick to its owner at a more leisurely
pace. If the dog's average speed is 8.8 m/s on its way to the stick, and 6.6 m/s on its way back, what is its average speed
for the entire round trip? (Assume that the time to pick up the stick and turn around is built into the two legs of the trip,
so there's no additional time to account for.)
2-64.
In Figure 2-35, the positions of three ants A, B, and C are plotted against clock reading t over a 25-s time interval.
|
|
a.
|
List these ants in rank order according to their average velocity during this time interval. Start with the value (lowest
or most negative) that would occur furthest to the left on a real number line. Make sure to indicate equalities if there are
any.
|
|
|
b.
|
List these ants in rank order according to their average speed during this time interval. See directions in part a.
|
|
|
2-65.
|
|
a.
|
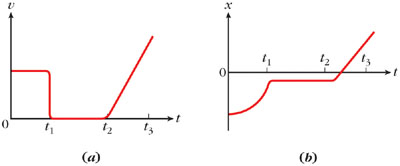
Graph a in Figure 2-36a shows an object's velocity plotted against t. Sketch a graph of its position x plotted against t.
|
|
|
b.
|
Repeat a, but this time assume the object is to the right of the origin at t = 0. (Did you make any assumption about where the object was at t = 0 when you answered part a the first time?)
|
|
|
c.
|
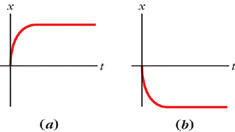
Graph b in Figure 2-36b shows an object's position plotted against t. Sketch a graph of its velocity against t.
|
|
|
2-66.
The velocity of a uniformly accelerated body increases from v1 = 8 m/s to v2 = 14 m/s over the interval from t1 = 2 s to t2 = 4 s. a. Find the body's acceleration. b. Find the body's initial velocity at t = 0.
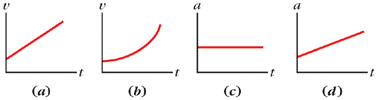
2-67.
SSM A laboratory cart starts out traveling to the right. Sketch a graph of its velocity v versus t
|
|
a.
|
if its acceleration is as shown in Figure 2-37a.
|
|
|
b.
|
if its acceleration is as shown in Figure 2-37b.
|
|
|
2-68.
For each of the graphs shown in Figure 2-38, tell whether Equations 2-9 through 2-12 can be used to treat the motion that the graph represents and briefly explain your answer.
2-69.
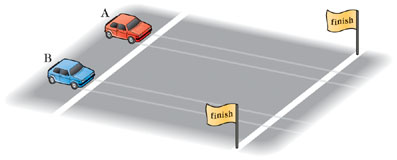
The two cars in Figure 2-39 start from rest at t = 0 and each accelerates at a constant rate until it crosses the finish line. If car A takes 20% longer than car B to cross
the finish line,
|
|
a.
|
how do the speeds at which the two cars cross the finish line compare? Express your answer as vA =
_________
vB. (Write the correct numerical multiplier in the blank.)
|
|
|
b.
|
how do the accelerations of the two cars compare? Express your answer as aA =
_________
aB. (Write the correct numerical multiplier in the blank.)
|
|
|
2-70.
|
|
a.
|
When you take a spoonful of honey and then let the honey run off in an unbroken stream, the stream is narrower at the bottom.
Why?
|
|
|
b.
|
If you allow the stream to descend a great enough distance from the spoon, why do you get a break in the stream at that distance?
|
|
|
2-71.
In each of the following cases, tell whether the object's position x doubles as the clock reading t doubles. Justify all your answers.
|
|
a.
|
The object passes the origin at t = 0 traveling along the x axis at constant speed.
|
|
|
b.
|
The object passes the point (3,0) at t = 0 traveling along the x axis at constant speed.
|
|
|
c.
|
The object passes the point (0,3) at t = 0 traveling parallel to the x axis at constant speed.
|
|
|
d.
|
The object starts from rest at the origin at t = 0 and has a constant acceleration in the positive x direction.
|
|
|
e.
|
The object passes the origin at t = 0 traveling at constant speed along a straight line making an angle of 30° with the x axis.
|
|
|
f.
|
The object is released from rest at the origin at t = 0 and is allowed to fall freely.
|
|
|
g.
|
The object starts from rest at the origin at t = 0 and travels in the positive x direction. Its speed is proportional to its distance from the origin.
|
|
|
2-72.
In each of the following cases, tell whether the object's velocity v doubles as the clock reading t doubles. Justify all your answers.
|
|
a.
|
The object starts from rest at the origin at t = 0 and has a constant acceleration in the negative x direction.
|
|
|
b.
|
The object passes the origin at a speed of 5 m/s at t = 0 and has a constant acceleration in the positive x direction.
|
|
|
c.
|
The object starts from the point (5,0) at t = 0 and has a constant acceleration in the positive x direction.
|
|
|
d.
|
The object is released from rest at the origin at t = 0 and is allowed to fall freely.
|
|
|
e.
|
The object is thrown straight up from the origin with an initial speed (at t = 0) of 10 m/s. (Neglect air resistance.)
|
|
|
2-73.
A car accelerates uniformly from rest to a speed of 20 m/s over a 6-s time interval, starting at t = 0.
|
|
a.
|
What is the car's average (time-averaged) speed during this time interval?
|
|
|
b.
|
At what instant is the car's instantaneous velocity equal to this average velocity?
|
|
|
c.
|
Over the entire 6 s, the car travels a certain distance. At the instant described in b, will the car have traveled half of this distance, more than half this distance, or less half this distance? Answer this without
doing any calculations, but briefly explain your reasoning.
|
|
|
d.
|
Now calculate the distance the car will have traveled at the instant described in b, and also at the instant t = 6 s. Use these results to check your answer to c, and if your answer to c was not correct, try to figure out why.
|
|
|
2-74.
A bus starts from rest and comes to a stop at a destination 30 miles away 1 hour later.
|
|
a.
|
What is the minimum number of instants (zero? one? two? more?) at which the bus must have had an instantaneous speed of 30
mi/hr during this trip?
|
|
|
b.
|
Is it possible to say when these instants occurred? Explain.
|
|
|
c.
|
What is the minimum number of instants (zero? one? two? more?) at which the bus must have had an instantaneous velocity of
30 mi/hr during this trip?
|
|
|
d.
|
Is it possible to say when these instants occurred? Explain.
|
|
|
2-75.
An auto race is held on a straight course. All motion is in the same direction. Race car A passes the starting line at t = 0 at a speed of 20 m/s.
|
|
a.
|
If it is capable of an acceleration of 7.0 m/s2, how far from the starting line will it be after 6 s?
|
|
|
b.
|
At the distance found in a, race car B overtakes car A. If car B started from rest from the starting line just as car A passed it, what acceleration
(assumed constant) did it maintain?
|
|
|
c.
|
At a certain instant, the two cars had the same velocity. Was this instant before t = 6 s, just at t = 6 s, or after t = 6 s? (Try to answer this without doing any calculation.)
|
|
|
d.
|
Now calculate the instant at which both cars had the same velocity. See if your result agrees with your answer to c.
|
|
|
2-76.
Race car A passes the starting line at a speed of 24 m/s and over the next 6 s has a constant acceleration of 6.0 m/s2. Race car B starts from rest from the starting line just as car A passes it and accelerates uniformly. At an instant 8 s
later, the two cars have the same velocity.
|
|
a.
|
On the same set of axes, sketch a graph of each car's velocity versus t.
|
|
|
b.
|
Is there a feature of this graph that tells you at what time car B passes car A? If so, tell what this feature is.
|
|
|
c.
|
Is there a feature of this graph that tells you at what time car B has the same velocity as car A? If so, tell what this feature
is.
|
|
|
2-77.
A proposed new unit of time is defined as the amount of time required for a sphere of solid lead 10−2 m in diameter to fall a distance of 1 m. How satisfactory is this as a unit of time? Explain.
2-78.
|
|
a.
|
If a raindrop was freely falling from a cloud at an altitude of 3000 m, with what speed would it strike the ground? (Neglect
variations in g.)
|
|
|
b.
|
Is the free fall approximation a good one for raindrops? Explain.
|
|
|
2-79.
|
|
a.
|
How far does a rock dropped from rest fall in 4 s?
|
|
|
b.
|
What is its velocity after 4 s?
|
|
|
c.
|
What is its average velocity over the 4 s interval?
|
|
|
d.
|
At what distance below its starting point does the rock's instantaneous velocity have the value you found in c? Compare this to the distance you found in a.
|
|
|
2-80.
In 1991, Carl Lewis set a new world record of 9.86 s for the 100-m dash. His “split times” for various parts of the 100 m distance were as follows (Data based on R. Myers, The Physics Teacher, 30, 89, 1992):
|
|
a.
|
Why did the first 10 m take the longest time?
|
|
|
b.
|
During which 10-m stretch was his average acceleration greatest? Estimate its value, and state any assumptions you make in doing your calculation.
|
|
|
2-81.
Problem 2-80 gives data for Carl Lewis's record run of the 100-m dash.
|
|
a.
|
During which 10 m stretch was his average speed greatest? What was its value?
|
|
|
b.
|
What was his average speed between 50 and 60 m?
|
|
|
c.
|
Estimate his average acceleration over this stretch. (Why can't you be sure it is an exact value?)
|
|
|
2-82.
The form of an equation can itself provide information. Answer the following without doing any calculations. Two cars A and B are stationary until t = 0. From t = 0 forward, the positions are given by xA = 300 − 50t and xB = 800 + 40t, when x is in meters and t is in seconds.
2-83.
SSM WWW Answer the following without doing any calculations. Two cars A and B are stationary until t = 0. From t = 0 forward, their velocities are given by vA = 30 − 4t and vB = 20 + 4t, when v is in m/s and t is in seconds.
2-84.
Answer the following without doing any calculations. The position of a certain bus traveling north on a straight road is given by x = 2t2 + 15t − 300, where x is in meters and t is in seconds. The origin is at the entrance to the bus depot.
|
|
a.
|
What is the bus's acceleration?
|
|
|
b.
|
Where is the bus at t = 0?
|
|
|
c.
|
How fast is it going at that instant?
|
|
|
d.
|
Which is the positive direction, north or south? How can you tell?
|
|
|
e.
|
Repeat b for the case when the position of a bus traveling north is given by x = 2t2 − 15t − 300.
|
|
|
f.
|
Repeat c for the case when the position of a bus traveling north is given by x = 2t2 − 15t − 300.
|
|
|
2-85.
The positions of several objects are shown at 1-s intervals in Figure 2-40. Choose the (one or more) objects that can possibly have constant nonzero accelerations over the entire time period shown.
Explain.
2-86.
Find the initial velocity and the acceleration of each of the objects in Figure 2-38 that has a constant acceleration.
2-87.
The motion of a laboratory cart over a certain interval of time is recorded on the position versus time graph in Figure 2-41. Is the cart speeding up or slowing down during this interval? Explain.
2-88.
The motion of an airplane is represented by the position versus time graph in Figure 2-42. During which time interval is the plane's average velocity greater, the interval from t = 2 s to t = 10 s or the interval from t = 2 s to t = 20 s? Explain.
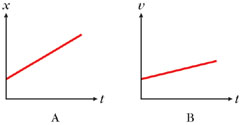
2-89.
Graphs A and B in Figure 2-43 represent the motions of two runners along the same straightaway. Which of these runners has the greater acceleration? Explain
your reasoning.
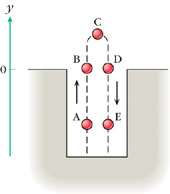
2-90.
Figure 2-44 shows the trajectory of a ball thrown straight up in the air from near the bottom of a pit. The upward and downward parts
of the trajectory actually are along the same straight line but are slightly shifted sideways in the diagram for readability.
Fill in each space in the table below with +, 0, or − to indicate whether the position, velocity, and acceleration are positive, zero, or negative for the indicated parts of the
trajectory.
|
|
|
|
|
|
|
|
While ball is going from A to B
|
|
|
|
|
|
|
|
|
While ball is going from B to C
|
|
|
|
|
|
|
|
|
|
|
|
|
|
While ball is going from C to D
|
|
|
|
|
|
|
|
|
While ball is going from D to E
|
|
|
|
|
|
|
|
|
2-91.
Three used cars are available from a dealer. When you floor the accelerator of each, car A achieves an acceleration of 29
mi/hr2, car B achieves an acceleration of 290 mi/hr2, and car C achieves an acceleration of 29 000 mi/hr2. Which car should you buy for normal highway driving? Explain.
2-92.
Parts a–e are separate, unconnected situations. For the car in each situation, determine whether it is possible to calculate
|
|
a.
|
Car A passes the 200-m mark on a test track at t = 2 s and the 260-m mark at t = 7 s.
|
|
|
b.
|
Car B passes the 200-m mark at t = 0 and experiences a uniform acceleration of 15 m/s2 for the next 5 s.
|
|
|
c.
|
Car C passes the starting line at a speed of 20 m/s. It has a uniform acceleration of 2.4 m/s2 for the next 5 s.
|
|
|
d.
|
Car E passes the starting line at a speed of 20 m/s. It has an average acceleration of 2.4 m/s2 for the next 5 s.
|
|
|
e.
|
The driver of car E steps on the brake as he sees himself approaching the edge of a very high cliff. The car reaches a velocity
negligibly greater than zero just as the car passes the cliff's edge. At this instant, the timer's stopwatch is started.
|
|
|
2-93.
A rocket is launched upward from atop the edge of a cliff at t = 0. It has an initial velocity of 39.2 m/s. It just misses the edge of the cliff on the way down.
|
|
a.
|
Find the two instants when it is 34.3 m above the cliff top.
|
|
|
b.
|
What is its velocity at each of these instants?
|
|
|
c.
|
The rocket lands at the base of the cliff 10 s after launching. How high is the cliff?
|
|
|
2-94.
The correct time is 2:35 PM. Your watch reads 2:40 PM.
|
|
a.
|
In ordinary language, would you say your watch is fast?
|
|
|
b.
|
Is your watch necessarily running any faster than a watch that reads the correct time? How could you test it to see whether
it is?
|
|
|
2-95.
A newspaper article reports, “Federal earthquake relief in 1994 is credited with accelerating the state's financial recovery by a full fiscal quarter.” Is the writer of this article using the idea of acceleration in a way that would be appropriate in physics? In particular,
is the writer speaking of a change (an increment) or a rate of change? In physics, does acceleration refer to a change or
a rate of change?
2-96.
Redo Example 2-11 without using Equations 2-9 to 2-12, the constant acceleration equations of motion (or kinematic equations). (That means you cannot use Equations 2-13 to 2-16
either.) Instead, start using the definitions of average velocity and average acceleration  and the fact that
  when the acceleration is constant.
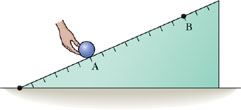
2-97.
The hand in Figure 2-45 rolls the ball up the ramp, releasing it at point A at t = 0. The ball gets as far as point B before coming back down.
|
|
a.
|
Sketch a graph of the ball's position plotted against clock reading t.
|
|
|
b.
|
Sketch a graph of the ball's velocity plotted against t.
|
|
|
c.
|
Sketch a graph of the ball's acceleration plotted against t.
|
|
|
2-98.
The hand in Figure 2-45 rolls the ball up the ramp, releasing it at point A at t = 0. The ball gets as far as point B before coming back down. If the marks on the ramp are 0.20 m apart,
|
|
a.
|
find the ball's acceleration.
|
|
|
b.
|
find the velocity with which the ball reaches the bottom of the ramp.
|
|
|
2-99.
A team of spelunkers (cave explorers) find an opening in the ground that seems to go straight down, but they cannot see how
far. They need to find this out before risking a descent. So they drop a rock, and 3.2 s later they hear it hit bottom. Assuming
that sound travels at a constant speed of 340 m/s, how far is the vertical drop?
2-100.
Repeat Example 2-5, using the time interval from t1 = 1.75 s to t2 = 2.25 s.
2-101.
Each of the phrases below describes one of the two graphs in Figure 2-46: negative slope, positive slope, quantity increasing with time, quantity decreasing with time, quantity becoming more negative
over time, quantity becoming less negative over time. Tell which of the graphs each phrase describes.
|
|
| Figure 2-46
Problem 2-101
|
2-102.
On planet Zork, which has no atmosphere, space explorers discover a jet of water shooting out of the ground with a speed of
20.0 m/s. If the jet of water reaches a maximum height of 16.67 m, what is the gravitational acceleration near the surface
of Zork?
2-103.
A Web site on pest control warns that Norway rats can jump vertically more than 77 cm. To do so, the speed with which they
propel themselves off the ground would have to exceed what value?
2-104.
A bored engineer rigs his toaster to pop the toast up much higher than usual. If a slice of toast falls back down to the toaster
1.5 s later, how high does the toaster pop up? (Neglect air resistance and low ceilings.)
2-105.
A certain vehicle requires a distance of 30 m to stop when it is traveling at 25 m/s.
|
|
a.
|
What acceleration is produced by braking under these conditions?
|
|
|
b.
|
If a jaywalker is 28 m in front of the vehicle when the driver first applies the brakes, how much time does the pedestrian
have to get out of the way?
|
|
|
Problems on WebLinks
2-106.
For the data in WebLink 2-1, we can also arrive at the instantaneous velocity at t = 3.00 s by considering progressively smaller intervals starting at this instant. Use the data from WebLink 2-1 to complete the following table, and from the table find the approximate instantaneous velocity at t = 3.00 s.
|
|
|
|
|
|
|
|
|
|
|
|
|
|
|
|
|
|
|
|
|
|
|
|
|
|
|
|
t = 3.00 s and t = 3.01 s
|
|
|
|
|
|
|
|
|
2-107.
Use the data from WebLink 2-1 to find the approximate instantaneous velocity at t = 2.995 s.
2-108.
In the last graph shown on WebLink 2-2, a. is y proportional to x? b. is Δy proportional to Δx?
2-109.
In the last graph shown on WebLink 2-2, a. is y proportional to x? b. is Δy proportional to Δx?
2-110.
A table presented in WebLink 2-3 gives data for a beaker of water placed on a balance. For each volume of water in the beaker, the table gives the total mass
on the balance.
|
|
a.
|
What is the mass of the beaker?
|
|
|
b.
|
Based on the data, calculate the density of water.
|
|
|
2-111.
In the table discussed in Problem 2-109,
|
|
a.
|
is the total mass m on the balance proportional to the volume V of the water in the beaker?
|
|
|
b.
|
is Δm proportional to ΔV?
|
|
|
2-112.
|
|
a.
|
In WebLink 2-4, is car C moving to the left or to the right over the 4-s interval shown?
|
|
|
b.
|
Is the speed of car C increasing, decreasing, or not changing during this interval?
|
|
|
2-113.
|
|
a.
|
In WebLink 2-4, is car D moving to the left or to the right over the 4-s interval shown?
|
|
|
b.
|
Is the speed of car D increasing, decreasing, or not changing during this interval?
|
|
|
2-114.
WebLink 2-5 shows the motion of a cart in each of the two situations shown in Figure 2-13. When the cart is in the situation shown in Figure 2-13b,
|
|
a.
|
its velocity at t = 2 s is
_________
.
positive and increasing;
positive and decreasing;
negative and increasing (becoming less negative);
negative and decreasing (becoming more negative).
|
|
|
b.
|
its velocity at t = 6 s is
_________
.
positive and increasing;
positive and decreasing;
negative and increasing (becoming less negative);
negative and decreasing (becoming more negative).
|
|
|
c.
|
its acceleration at t = 2 s is
_________
and its acceleration at 6 s is
_________
.
positive … positive;
positive … negative;
negative … positive;
negative … negative.
|
|
|
2-115.
Repeat Problem 2-114 for the case when the cart is in the situation shown in Figure 2-13a
|
|
Copyright © 2004 by John Wiley & Sons, Inc. or related companies. All rights reserved.
|

 ; between
 between
  and
and